
Figure 1. Composite measurements of sparse module activity.
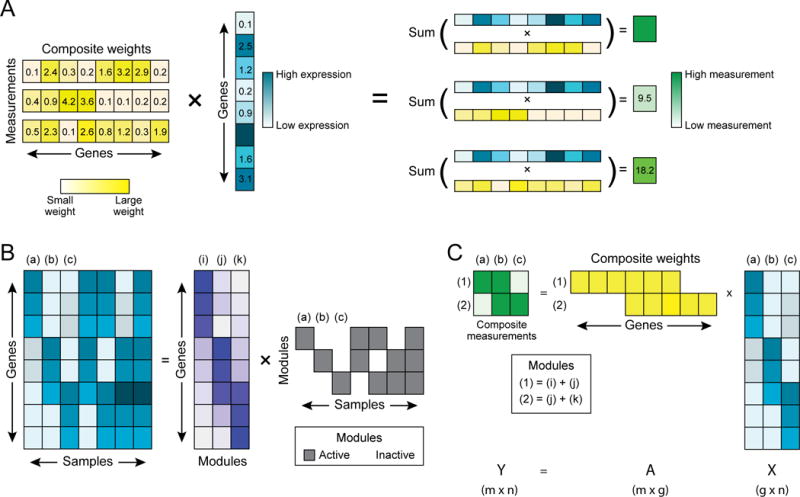
(A) Schematic example of three composite measurements (green, right) constructed from one vector of gene abundances (cyan). Each measurement is a linear combination of gene abundances, with varying weights (yellow) for each gene in each measurement. (B) Decomposition of gene abundance across samples by the activity of gene modules. The expression of genes (rows) across samples (columns) (left cyan matrix) can be decomposed into gene modules (purple matrix; rows: genes; columns: modules) by the modules’ activity (grey matrix, rows) across the samples (grey matrix; columns). If only one module is active in any sample (as in samples a, b, and c) then two composite measurements are sufficient to determine the gene expression levels (part C). (C) One such measurement (1) is composed from the sum of modules (i) and (j), and another (2) is composed from the sum of modules (j) and (k).