
Figure 2. Clusters based on composite measurements match high-dimensional clusters.
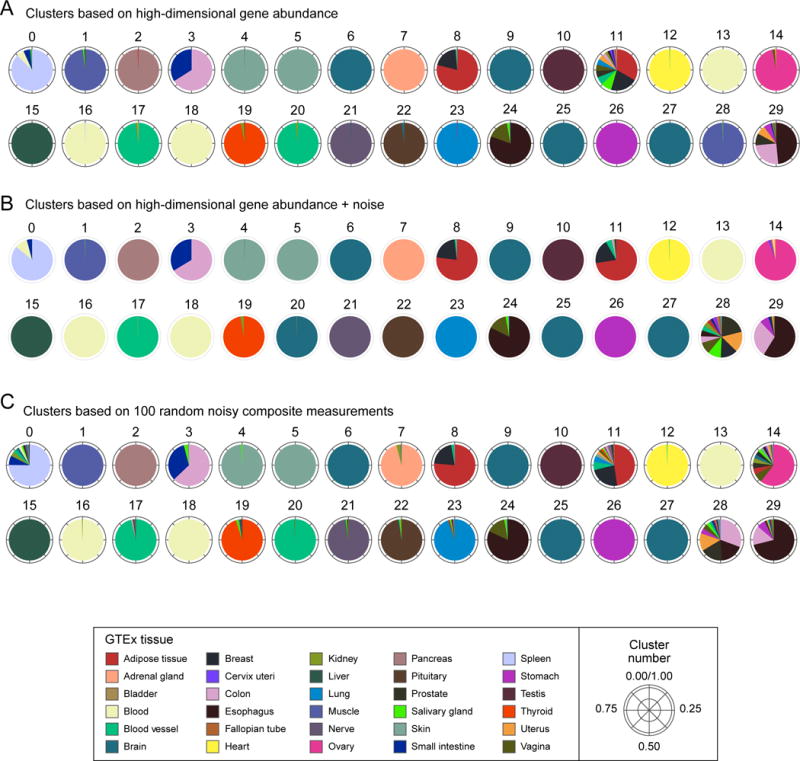
Shown are 30 clusters of GTEx samples (0–29; arbitrary order) based on (A) expression of 14,202 genes, (B) gene expression plus the addition of random noise (SNR=2), or (C) 100 random noisy composite measurements. Clusters in both (B) and (C) match the original clusters, with 91% and 87% mutual information, respectively (cluster numbers were manually reassigned to align with (A)). Each pie chart corresponds to one cluster and shows the composition of samples in the clusters by the individual tissues (colors, legend). Deviations from the original clusters which appear in both (B) and (C) (e.g. cluster 28) likely indicate the effects of noise, rather than loss of information in low dimension.