
Figure 3. Sparse Modular Activity Factorization (SMAF) for gene expression.
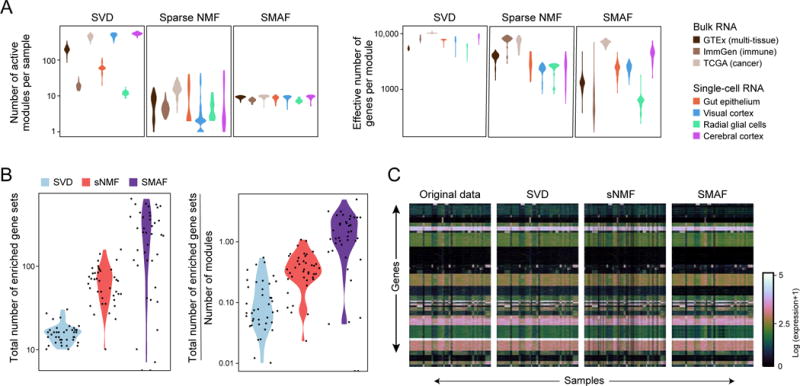
(A, B) Performance of different matrix decomposition algorithms. (A) Violin plots of the distribution of the number of active modules per sample (y-axis, left), and the effective number of genes per module (y-axis, right) for each of three methods, across different datasets (x axis, legend). (B) Violin plots of the total number of enriched gene sets across all modules within a dataset (left), and total number of enriched gene sets divided by the number of modules (right), for each of the three different algorithms. Each dot represents one dataset. (C) Original data, and reconstructed high-dimensional gene expression levels for each algorithm. Heat maps show, for the GTEx dataset the original gene expression profiles (left; 8,555 samples, 14,202 genes) and the profiles reconstructed from SVD, sNMF, and SMAF.