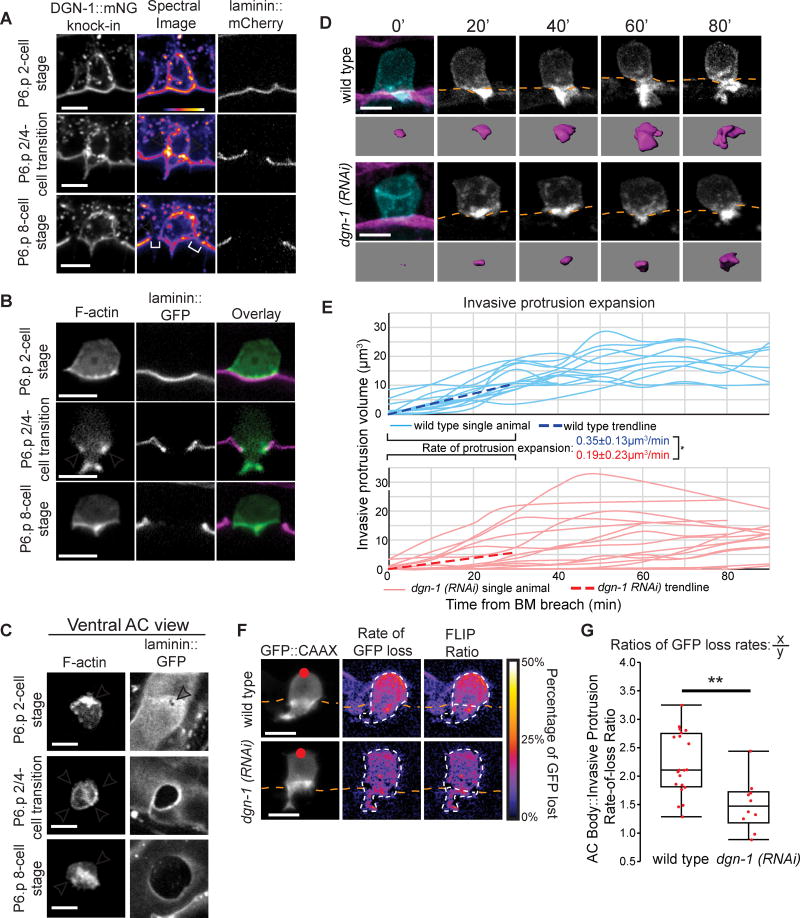
Figure 6. The BM receptor dystroglycan (DGN-1) forms a membrane diffusion barrier that promotes protrusion formation.
(A) ACs expressing dgn-1::mNG (dgn-1 qy18) (left) and spectral representations of fluorescence intensity (center), with BM (laminin::GFP, right). DGN-1::mNG protein localizes to the invasive membrane before invasion (top), concentrates at the AC-BM interface (arrowheads) at the neck of the protrusion (middle), and is lost at this location (bottom) as the BM moves beyond the AC (brackets). The protrusion also retracts at this time. (B) F-actin (cdh-3>mCherry::moesinABD) similarly concentrates at the neck of the invasive protrusion at the AC-BM interface (arrowheads) during protrusion formation. (C) Ventral view of the AC-BM interface shows Factin localization at the site of initial BM breach (top, arrowhead), in a ring (arrowheads) at the AC-BM contact site as the BM hole expands (middle), which is then lost (arrowheads) after the BM gap extends beyond the AC (bottom). (D) Time-lapse of AC protrusion formation in a uterine-specific RNAi strain with the AC membrane labeled by cdh-3>mCherry::PLCδPH, blue and greyscale, purple isosurface below; BM (laminin::GFP, magenta) position shown by orange dotted lines. (E) AC protrusion volume over time for wild type (blue) and dgn-1 (RNAi) (red). Average expansion rates (dotted lines) ± SD for first 30 minutes of protrusion growth (n=14 animals for wild type, n=16 animals for dgn-1 (RNAi); *p<0.05, Student's t-test). Wild type controls were the same as in Figure 2D. (F) Fluorescence loss in photobleaching (FLIP) of AC membrane reporter (cdh-3>GFP::CAAX). Red dot indicates target of photobleaching (left). A smoothed spectral intensity map of percentage of GFP lost (center). The white dotted lines outline the AC. FLIP ratios (right) were determined by dividing the average loss in the region of photobleaching (X) by the average loss in the region of the AC not targeted (Y). (G) FLIP ratios for wild type and dgn-1 (RNAi). Controls were shared with the 2/4-cell transition data in Figure 5D (n=20 animals for wild type, n=10 animals for dgn-1 (RNAi); **p<0.01, Student's t-test). Scale bars = 5µm. See also Figure S6.

