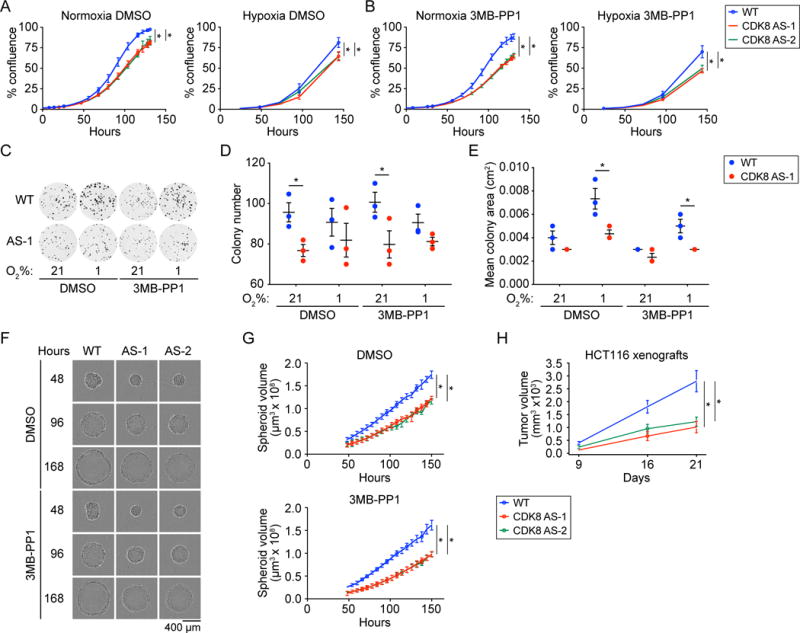
Figure 2. CDK8 activity is required for proliferation and tumorigenic properties of HCT116 cells.

(A and B) Growth curves for WT and two independent homozygous CDK8as/as clones (AS-1 and AS-2) under normoxic and hypoxic (1% O2) conditions, and treated with (A) DMSO vehicle, or (B) 10 μM 3MB-PP1. Percentage confluence was monitored using an Incucyte imaging system. Data are represented as mean ± SEM from three independent replicates. Asterisks indicate significant differences (unpaired t test, p < 0.05).
(C) Clonogenic cell survival assay for WT and CDK8 AS-1 in normoxia and hypoxia (1% O2), and treated with vehicle (DMSO) or 10 μM 3MB-PP1. Representative images shown.
(D) Clonogenic colony number for cells treated as in C. Individual replicates are shown as circles. Lines and whiskers represent mean ± SEM from three independent replicates. Asterisks indicate significant differences (unpaired t test, p < 0.05).
(E) Clonogenic colony area for cells treated as in C. Individual replicates are shown as circles. Lines and whiskers represent mean ± SEM from three independent replicates. Asterisks indicate significant differences (unpaired t test, p < 0.05).
(F) Spheroid growth assay for WT and two independent homozygous CDK8as/as clones (AS-1 and AS-2) in normoxia, treated with vehicle (DMSO) or 10 μM 3MB-PP1. Representative images acquired using an Incucyte imaging system are shown.
(G) Growth curves for WT, AS-1, and AS-2 spheroids, treated as in G. Spheroid volume was calculated from area as monitored using an Incucyte imaging system. Data are represented as mean ± SEM from three independent replicates. Asterisks indicate significant differences (unpaired t test, p < 0.05).
(H) Xenograft tumor growth assay with wild-type and CDK8as/as HCT116 cells injected into the flanks of nude mice. Data are represented as mean ± SEM from 20 tumors per group. Asterisks indicate significant differences (unpaired t test, p < 0.05).
