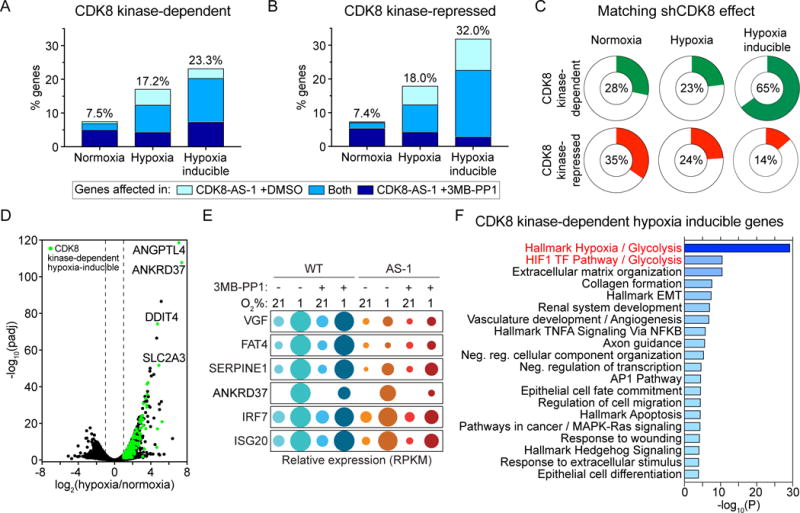
Figure 3. Inhibition of CDK8 has widespread effects on the transcriptome.

(A and B) Proportions of genes expressed during normoxia and hypoxia, or induced by hypoxia, that (A) depend on CDK8 kinase activity or (B) are repressed by CDK8 kinase activity. Colors indicate the relative numbers of genes affected in CDK8-AS-1 treated with vehicle (DMSO) (light blue) or 10 μM 3MB-PP1 (dark blue), or in both conditions (medium blue). All subsequent analyses combine genes affected in CDK8-AS-1 ±3MB-PP1 (see Table S1).
(C) Proportions of CDK8 kinase-dependent or –repressed genes for which CDK8 knockdown (shCDK8) produces an effect in the same direction.
(D) Volcano plot of log2 fold change (hypoxia/normoxia) against -log10(FDR adjusted p value) for WT HCT116 cells, with hypoxia inducible CDK8-dependent genes highlighted in green. Selected genes of interest are labelled.
(E) Bubble plots showing relative mRNA levels for example CDK8-dependent hypoxia inducible genes. Circle area corresponds to mean RPKM values relative to condition with maximum expression.
(F) Top 20 clusters from Metascape pathway enrichment analysis of the 292 CDK8-dependent hypoxia-inducible genes. Color and length of bars represents −log10(p value), based on the best-scoring term within each cluster.
See also Figure S3, Table S1, and Table S2.
