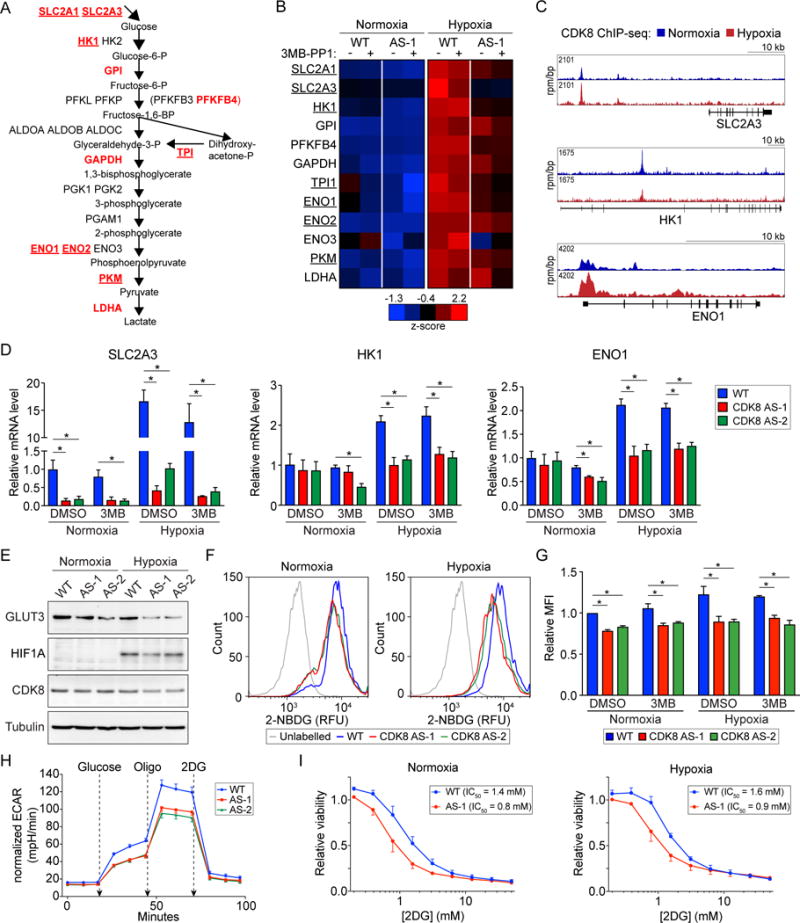
Figure 4. Inhibition of CDK8 impairs glucose uptake and glycolysis.

(A) Outline of the glycolysis pathway with metabolites in boxes. Glycolytic genes induced by hypoxia in HCT116 cells are listed at their corresponding step. Genes dependent on CDK8 kinase activity in hypoxia are listed in red, while those also dependent on CDK8 kinase activity in normoxia are underlined.
(B) Heat map showing relative expression of CDK8 kinase-dependent glycolytic genes in WT and CDK8-AS-1 cells across normoxic and hypoxic conditions ± treatment with 10 μM 3MB-PP1. Data are represented as z-scores of mean RNA-seq RPKM values.
(C) Genome browser views of CDK8 binding at selected CDK8 kinase-dependent glycolytic genes under normoxic (blue) and hypoxic (red) conditions.
(D) Relative mRNA levels for selected CDK8 kinase-dependent glycolytic genes, as assessed by qRT-PCR, under normoxic and hypoxic conditions ± treatment with 10 μM 3MB-PP1. Expression values were normalized to 18S ribosomal RNA and are expressed relative to the mean of DMSO treated wild-type samples. Data are represented as mean ± SEM from three independent replicates. Asterisks indicate significant differences (unpaired t test, p < 0.05).
(E) Western blot showing levels of GLUT3, HIF1A, and CDK8 in WT vs. CDK8-AS-1 and -AS-2 cells under normoxic and hypoxic conditions.
(F) Representative histograms of relative fluorescence for unlabeled vs. 2-NBDG-labelled WT and CDK8-AS-1 and -AS-2 cells in normoxic and hypoxic conditions, treated with vehicle (DMSO).
(G) Relative uptake of 2-NBDG by WT and CDK8-AS-1 and -AS-2 cells in normoxic and hypoxic conditions, and treated with vehicle (DMSO) or 10 μM 3MB-PP1. Data are represented as mean ± SEM from three independent replicates. Asterisks indicate significant differences (unpaired t test, p < 0.05).
(H) Glycolytic function of WT vs. CDK8-AS-1 and -AS-2 cells, as measured by extracellular acidification rate (ECAR), when starved of glucose for 1 hr, and after addition of glucose followed by oligomycin (oligo) and 2DG. Data are represented as mean ± SEM from five independent replicates. Asterisks indicate significant differences (unpaired t test, p < 0.05).
(I) 2DG dose-response curves for WT and CDK8-AS-1 cells under normoxic and hypoxic conditions. Data are represented as mean ± SEM from three independent replicates.
See also Figure S4 and Table S1.
