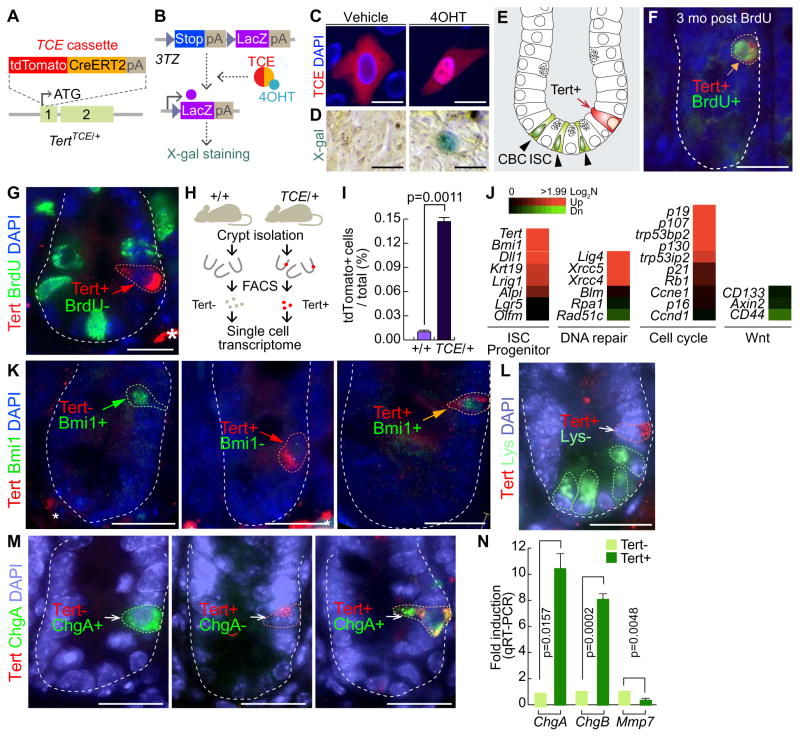
Figure 1. Characterization of Tert+ cells in the intestine.
(A) Generation of the TertTCE/+ knock-in mouse model by gene targeting. tdTomato-CreERT2 (TCE) cassette was inserted in frame into the Tert allele.
(B) Conditional activation of TCE by 4-hydroxytamoxifen (4OHT). 3TZ cells were transfected with a TCE-expressing plasmid. 4OHT-activated TCE induces Cre-loxP recombination, resulting in expression of LacZ, detected by β-galactosidase (X-gal) staining.
(C) Nuclear translocation of TCE by 4-OHT. HeLa cells were transfected with TCE plasmid and treated with 4OHT (100 μM for 24 hr). Scale bars=20μm.
(D) TCE-induced Cre-LoxP recombination by 4-OHT. 3TZ cells were transfected with TCE plasmid, treated with 4OHT (100 μM for 36 hr), and visualized by β-galactosidase (X-gal) staining. Scale bars=20μm.
(E) Illustration of ISCs and Tert+ cells in the small intestine. Tert+ cells are located at position 4 (+4) (arrow), while the crypt base columnar (CBC) ISCs are located at the bottom of crypts (arrowheads).
(F) Label-retaining cell assay. TertTCE/+ mice (2 wk of age) were injected with BrdU and tissues collected at 3 mo of age. Tert+:BrdU+ cell is indicated by an arrow. Scale bars=20μm.
(G) 5-Bromo-2-deoxyuridine (BrdU) incorporation assay. Briefly, TertTCE/+ mice were injected with BrdU (1 mg in PBS) 30 min before tissue collection and the small intestine was subjected to IF staining. Tert+:BrdU− cells are indicated by an arrow. Asterisk: non-specific signal. Scale bars=20μm.
(H–I) Detection and isolation of Tert+ cells using fluorescence-activated cell sorting (FACS).
(J) Single cell gene expression profiling of Tert+ cells compared to Tert− cells.
(K) Tert+ cells partially overlap with Bmi1+ cells in the small intestine.
(L) Tert+ cells do not overlap with lysozyme+ cells (Paneth cell) in the small intestine.
(M) Tert+ cells partially overlap with ChgA+ cells (enteroendocrine cell) in the small intestine. IHC of Tert− :Bmi1+, Tert+:Bmi1−, Tert+:Bmi1+, Tert+:Lysozyme−, Tert− :ChgA+, Tert+:ChgA−, Tert+:ChgA+ cells from the TertTCE/+ mice. Scale bars=20μm.
(N) Expression of ChgA, ChgB, and Mmp7 in Tert+ cells. Tert+ cells were isolated from TertTCE/+ mice and markers for Paneth and enteroendocrine cells were assessed by qRT-PCR. Tert− cells were used as the control sample. Error bars indicate s.e.m.
The representative images are shown; N≥3.

