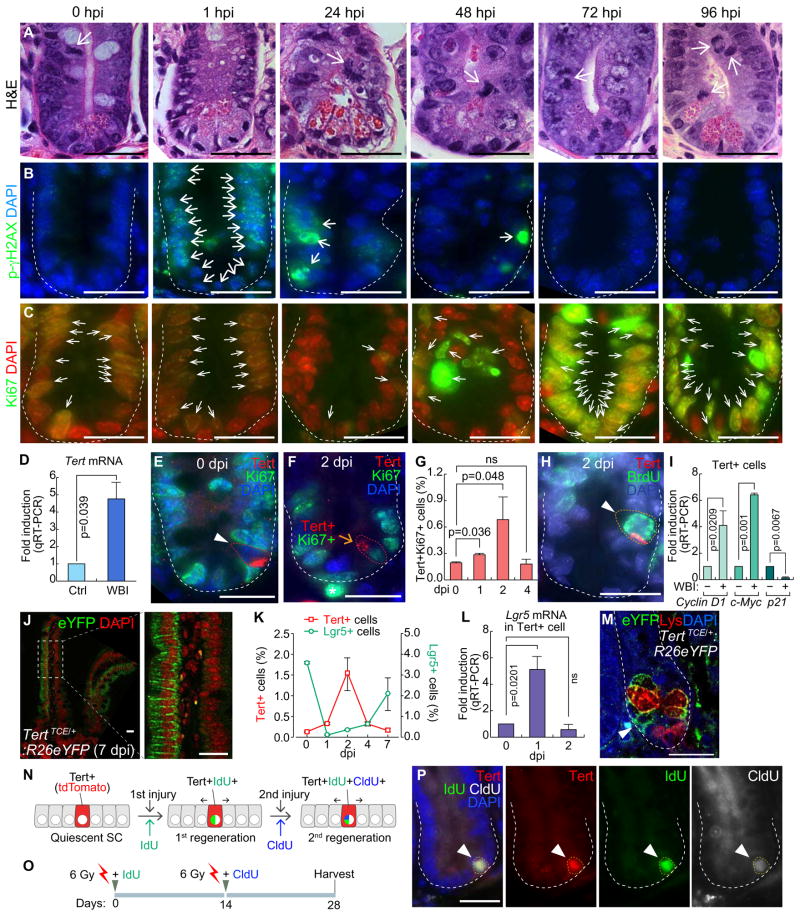
Figure 2. Quiescence exit of Tert+ cells upon radiation injury.
(A–C) Regeneration of intestinal crypt upon IR injury. Mice (5 wk) were treated with whole body irradiation (WBI; 10 Gy; a single dosage). H&E staining (A); DNA damage foci (phospho-gamma histone H2AX) (B); proliferation (Ki67) (C). Hour post injury (hpi); scale bars=20μm.
(D) Tert mRNA upregulation in the crypts after WBI (10 Gy). qRT-PCR of intestinal crypts at 24 hpi.
(E) Quiescence of Tert+ cells during intestinal homeostasis. Tert+:Ki67− cells (arrowhead) of TertTCE/+ mice. Day post injury (dpi); scale bars=20μm.
(F) Activation of Tert+ cells during regeneration (10 Gy, 2 dpi). Tert+:Ki67+ cells (arrow) of TertTCE/+ mice. Scale bar=20μm.
(G) Quiescence exit of Tert+ cells by WBI. TertTCE/+ mice treated with WBI (10 Gy) were collected (0, 1, 2, and 4 dpi) for assessing Tert+:Ki67+ cells using FACS.
(H) Mitotic activation of Tert+ cells by WBI. TertTCE/+ mice were treated with WBI (10 Gy). At 2 dpi, BrdU (1mg/ml, i.p.) was administrated 30 min before tissue collection and the small intestine was subjected to IF staining. Tert+:BrdU+ cells (arrowhead). Scale bars=20μm.
(I) Expression of cell cycle-related genes in Tert+ cells. TertTCE/+ mice were treated with WBI (10 Gy, 24 hpi) and subjected to Tert+ cell isolation from intestinal crypts using FACS and qRT-PCR for Cyclin D1, c-Myc, and p21 expression.
(J) Lineage-tracing of Tert+ cells. TertTCE/+:R26eYFP mice were treated with 4OHT and WBI (10 Gy). At 7 dpi, cryosectioned, small intestine samples were analyzed for YFP expression.
(K) Comparative analysis of Tert+ and Lgr5+ cell populations after WBI (10 Gy). FACS analysis of Tert+ cells (tdTomato) from TertTCE/+ and Lgr5+ cells (GFP) from Lgr5EGFP-IRES-creERT2 mouse models.
(L) Expression of Lgr5 in Tert+ cells. TertTCE/+ mice were treated with WBI (10 Gy; 0, 1, 2 dpi) and subjected to Tert+ cell isolation from intestinal crypts using FACS and qRT-PCR for Lgr5 expression.
(M) Lineage-tracing of Tert+ cells. TertTCE/+:R26eYFP mice were treated with 4OHT and WBI (10 Gy). At 7 dpi, YFP+ cells (arrowhead) were found at the bottom of the crypt in between Paneth cells (lysozyme+ cells).
(N–P) Sequential injury-induced Tert+ cell activation. Illustration of Tert+ cell activation by consecutive tissue injuries (N). Scheme of mouse treatment (O). Of note, instead of a lethal dose (10 Gy), a sub-lethal dose WBI (6 Gy) was used, with IdU and CldU. Tert+:IdU+:CldU+ cells were visualized (28 dpi; arrowhead) (P).
The representative images are shown; N≥3; error bars indicate s.e.m.; ns: non-significant (P≥0.05).

