. 2017 Dec 12;6:e29330. doi: 10.7554/eLife.29330

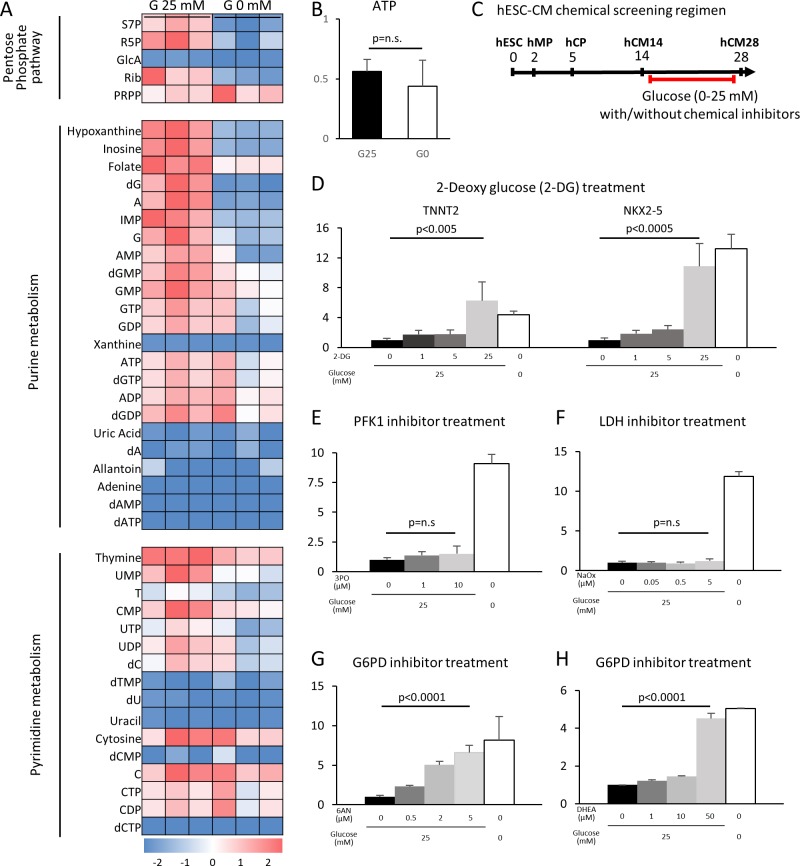
Figure 4. The pentose phosphate pathway inhibits cardiac maturation.

(A) Heatmap presentation of the metabolomics analysis of hESC-CMs cultured in the presence or absence of glucose. Note the decrease in the metabolites in purine metabolism, pyrimidine metabolism and the pentose phosphate pathway (PPP) in glucose-deprived conditions (n = 3, each). GlcA, glucuronic acid; R5P, ribose 5-phosphate; Rib, ribose; PRPP, phosphoribosyl pyrophosphate; S7P, sedoheptulose-7-phosphate. See also Figure 4—figure supplement 2. (B) ATP levels of hESC-CMs in 25 mM glucose medium (G25) and glucose-depleted medium (G0) (n = 3, mean ± SD, p = n .s. by t-test.) (C) Experimental regimen for chemical inhibition of glucose metabolic pathways. hESC-CMs are cultured in the medium containing four different glucose levels and different chemical inhibitors. See also Figure 4—figure supplement 3. (D) Relative mRNA expression of TNNT2 and NKX2-5 in different concentrations of glucose and 2-DG, a competitive inhibitor of glucose. 2-DG restored cardiac maturation in the presence of glucose. (E–H) Relative mRNA expression of TNNT2 in 0–25 mM glucose and with different chemical inhibitors of the glucose metabolic pathways: 0–10 μM 3PO (3-(3-pyridinyl)−1-(4-pyridinyl)−2-propen-1-one, a phosphofructokinase [PFK] inhibitor) (E); 0–5 mM sodium oxamate (NaOX; a lactate dehydrogenase [LDH] inhibitor) (F); 0–5 μM 6AN (6-aminonicotinamide, a glucose 6-phosphate dehydrogenase [G6PD] inhibitor) (G); and 0–50 μM DHEA (dehydroepiandrosterone, a G6PD inhibitor) (H). (n = 3, each. mean ± SD; p-value by one-way ANOVA.) See also Figure 4—figure supplement 4.

Figure 4.

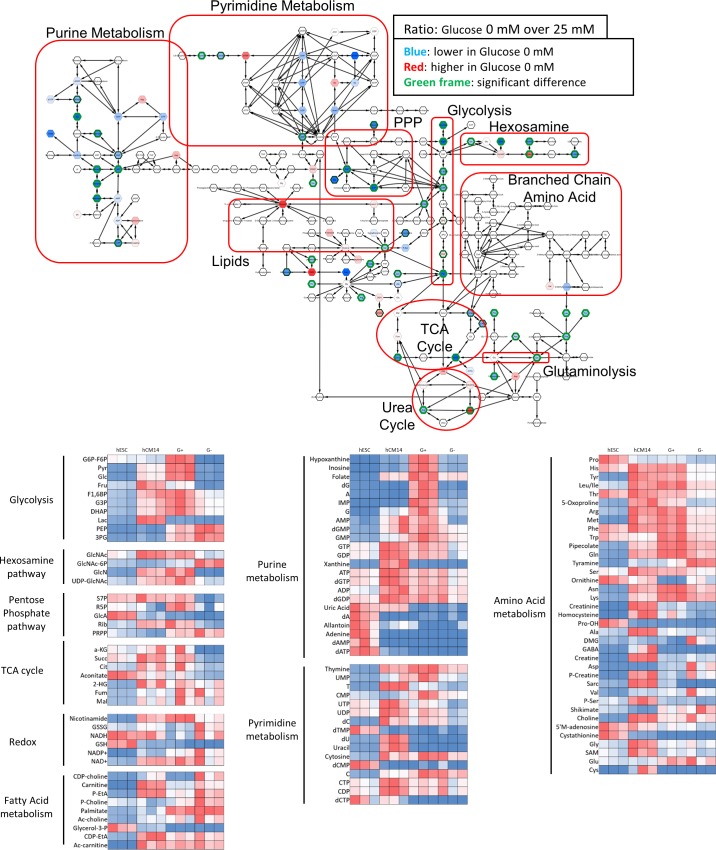
Figure 4—figure supplement 1. Metabolomics analyses by mass spectrometry.

Figure 4—figure supplement 1.

The top diagram shows the comparison of metabolomics analysis by mass spectrometry of hESC-CMs cultured in the presence or absence of glucose. Each hexagon indicates a metabolite that is decreased (blue) or increased (red) in the absence of glucose. A green outline indicates statistically significant change. Note the decrease in the metabolites in purine metabolism, pyrimidine metabolism, the PPP, the hexosamine pathway, and glycolysis. (n = 3, each.) The bottom part of the figure shows the heatmap of metabolite levels measured by mass spectrometry of hESC, of hCM14, and of hCM28 cultured in 25mM glucose (G+) or without glucose (G–).
Figure 4—figure supplement 2. RNAi knockdown of glucose metabolic enzymes.
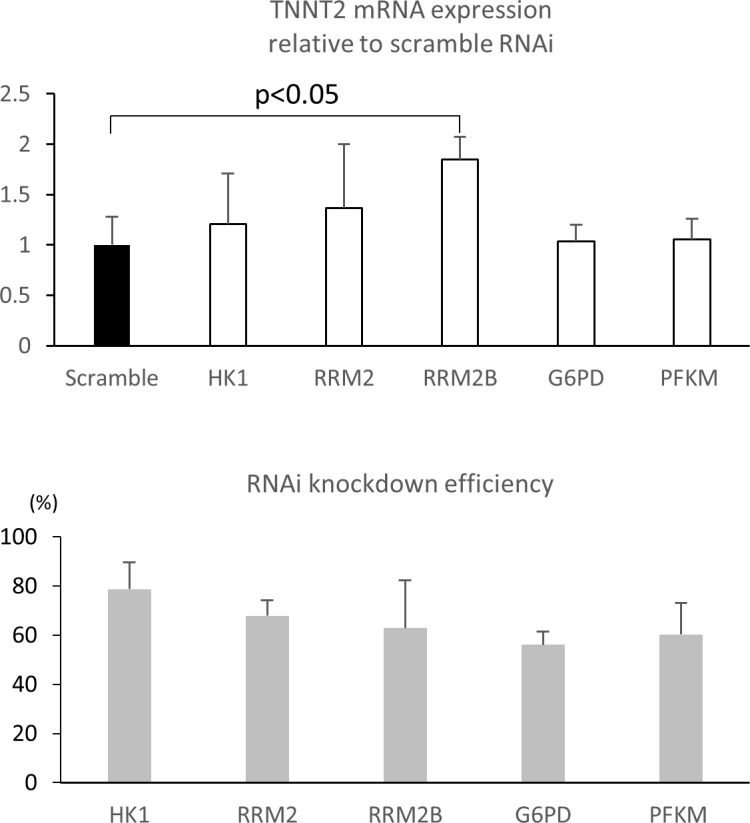
Figure 4—figure supplement 2.

Relative TNNT2 expression after RNA interference (RNAi) knockdown. RNAi targeting scramble, HK1, RRM2, RRM2B, G6PD, and PFK were transfected by lipofection for 48 hr followed by 7 days’ incubation with 25 mM glucose. (n = 3, each group; mean ± SD, p<0.05 between RRM2B and scramble by t-test.) The bottom panel shows the RNAi knockdown efficiency for the glucose metabolic enzymes.
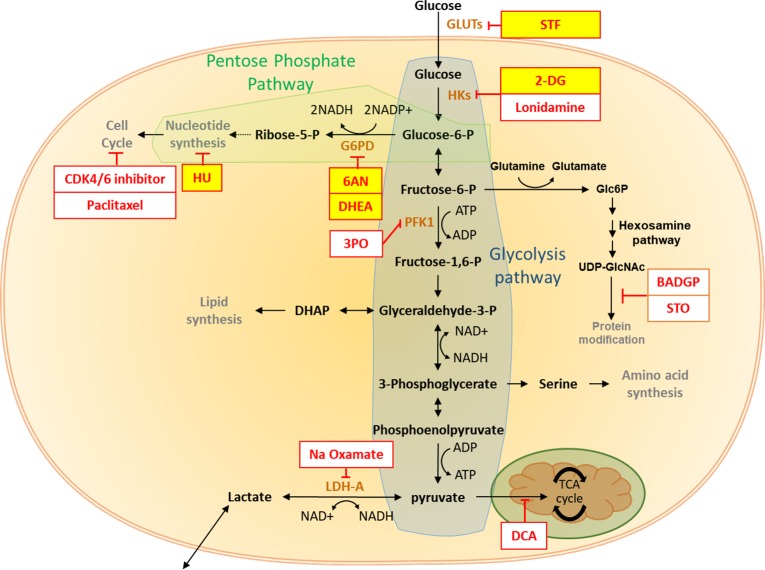
Figure 4—figure supplement 3. The pentose phosphate pathway inhibits cardiac maturation.

Figure 4—figure supplement 3.

Summary of the impact of glucose metabolism inhibitors on cardiac maturity. The inhibitors tested are shown in red boxes, and the effective inhibitors are highlighted in yellow. There is clear evidence that inhibition of PPP increases the maturity of hESC-CMs.
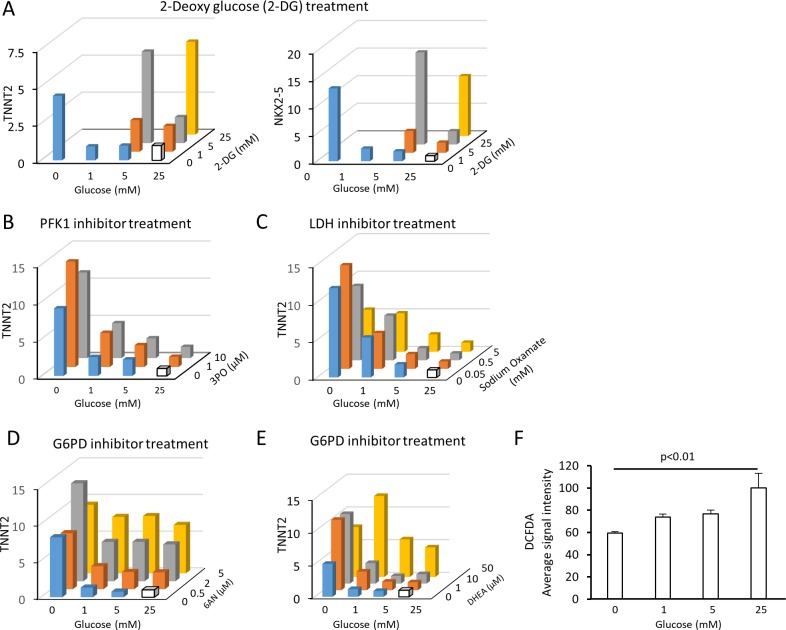
Figure 4—figure supplement 4. Summary of the impact of glucose metabolism inhibitors on cardiac maturity.

Figure 4—figure supplement 4.

(A) Relative mRNA expression of TNNT2 and NKX2-5 in conditions of 0–25 mM glucose and 0–25 mM 2-DG. No data were available for the samples with 2-DG concentration higher than its glucose level because of the cytotoxicity of 2-DG. 2-DG dose-dependently restored cardiac maturation in the presence of glucose. Data are representative of three independent experiments. (B) Relative mRNA expression of TNNT2 in 0–25 mM glucose and 0–10 μM 3PO (a PFK inhibitor). 3PO failed to restore the effect of glucose deprivation. Data are representative of three independent experiments. (C) Relative mRNA expression of TNNT2 in 0–25 mM of glucose and 0–5 mM sodium oxamate (NaOX; an LDH inhibitor). Sodium oxamate failed to restore the effect of glucose deprivation. Data are representative of three independent experiments. (D) Relative mRNA expression of TNNT2 in 0–25 mM of glucose and 0–5 μM 6AN (a G6PD inhibitor). 6AN dose-dependently restores the effect of glucose deprivation, suggesting that the pentose phosphate pathway plays a critical role in the glucose-dependent inhibition of cardiac maturation. Data are representative of three independent experiments. (E) Relative mRNA expression of TNNT2 in 0–25 mM of glucose and 0–50 μM DHEA (a G6PD inhibitor). DHEA dose-dependently restores the effect of glucose deprivation, suggesting that pentose phosphate pathway plays a critical role in the glucose-dependent inhibition of cardiac maturation. Data are representative of three independent experiments. (F) Reactive oxygen species (ROS) level is measured by the signal intensity of dichlorodihydrofluorescein diacetate (DCFDA). Glucose reduction does not cause an increase in ROS level despite the increased mitochondrial function of hESC-CMs cultured in low glucose medium. (n = 4; p-value by one-way ANOVA).