. 2017 Nov 30;6:e31476. doi: 10.7554/eLife.31476

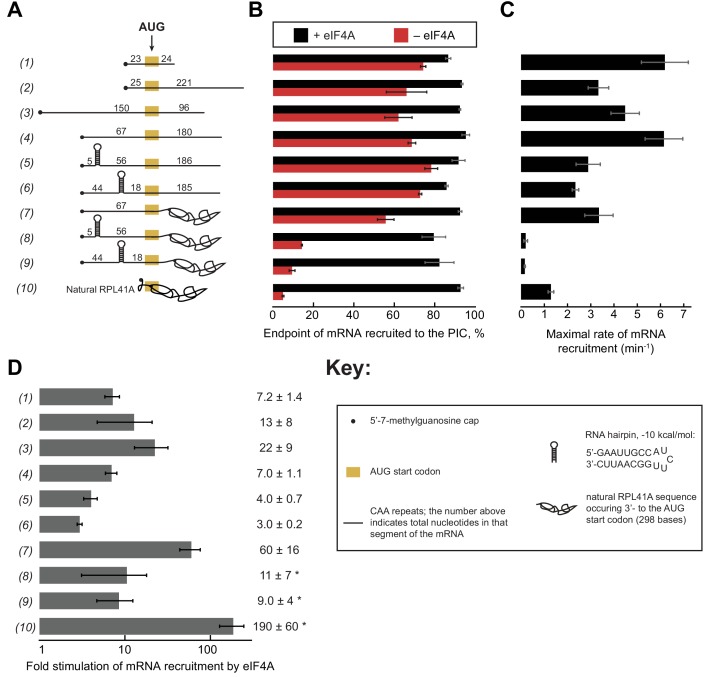
Figure 3. eIF4A stimulates recruitment of mRNAs regardless of their degree of structure.

(A) Schematic of mRNAs used in the study. mRNAs were capped unless otherwise noted but do not contain a poly(A) tail. Numbers on the mRNA indicate the total number of nucleotides in the corresponding segment of the RNA. (B) Endpoints of recruitment to the PIC for mRNAs in (A) in the presence (black) or absence (red) of saturating eIF4A. mRNAs are listed in the same order as in (A). (C) Maximal rates of mRNA recruitment, kmax (min−1), measured for the mRNAs in (A) (the corresponding plots are shown in Figure 3—figure supplement 1B–D) listed in the same order as in (A). (D) eIF4A-dependent stimulation of mRNA recruitment: the maximal rate of mRNA recruitment at saturating eIF4A concentration divided by the observed rate in the absence of eIF4A (calculated from data in Figure 3—figure supplement 1E). Numbers to the left correspond to the mRNAs in (A). The asterisk (*) indicates that due to low recruitment endpoints in the absence of eIF4A, data for mRNAs 8–10 could not be fit with an exponential rate equation and thus the fold stimulation by eIF4A was estimated from comparison of initial rates in the presence of saturating eIF4A versus the absence of eIF4A. All data presented in the figure are mean values (n ≥ 2) and error bars represent average deviation of the mean.

Figure 3—source data 1. Individual measurements of endpoints and rates of mRNA recruitmentment for mRNAs 1–10.
DOI: 10.7554/eLife.31476.013
Figure 3—source data 2. Related to Figure 3—figure supplement 1.
Observed rates (kobs) of mRNA recruitment for mRNAs 1–10 at varying concentrations of eIF4A.
DOI: 10.7554/eLife.31476.014

Figure 3.

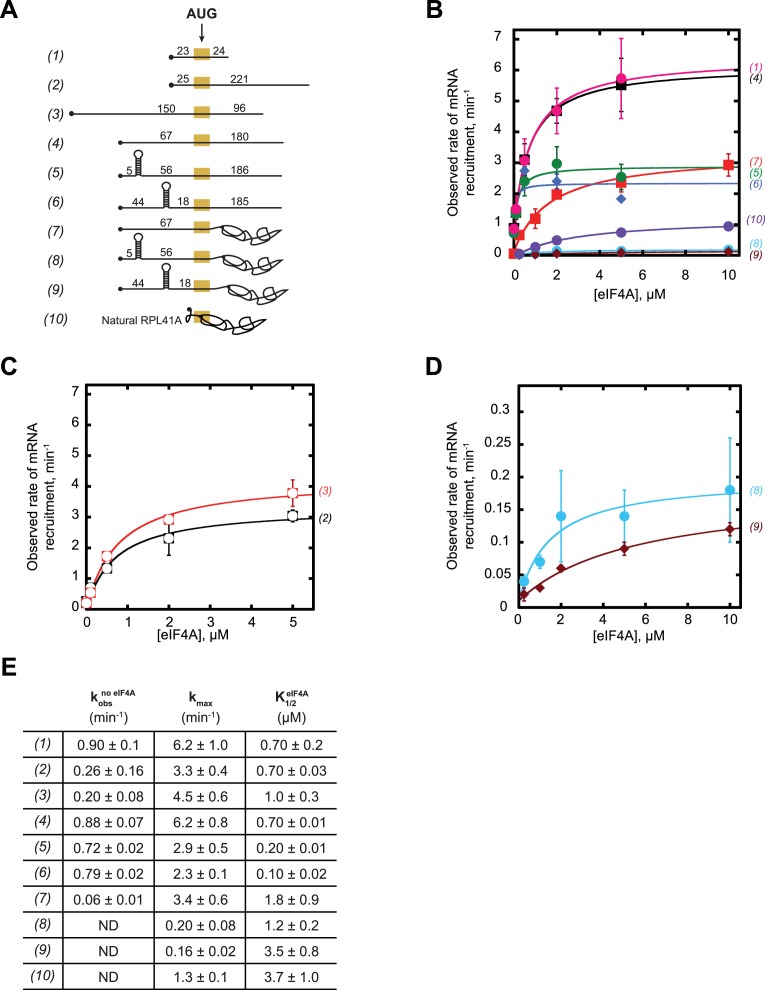
Figure 3—figure supplement 1. eIF4A promotes recruitment of both structured and CAA-repeats mRNAs.

Figure 3—figure supplement 1.

(A) RNAs used in the study (same as (A) in Figure 3, shown again here for convenience). (B–C) Observed rates (kobs) min−1 of mRNA recruitment as a function of the concentration of eIF4A. Data were fit with a hyperbolic equation allowing for a y-intercept >0 (see Materials and methods). Numbers in parentheses, to the right of the coordinate plane, correspond to mRNAs in (A) and are colored for easier visualization of distinct curves. RNAs 2 and 3 are shown separately for clarity. (D) Expansion of plots for mRNAs 8 and 9 from (B) for clarity. (E) The observed rate of recruitment in the absence of eIF4A (kobsno eIF4A), the maximal rate of recruitment with saturating eIF4A (kmax), and the concentration of eIF4A required to achieve the half-maximal rate of recruitment (K1/2eIF4A) from fits in panels B-D. ‘ND':’ the observed rate from an exponential fit could not be determined because of low reaction endpoint. All data presented in the figure are mean values (n ≥ 2) and error values are average deviation of the mean.
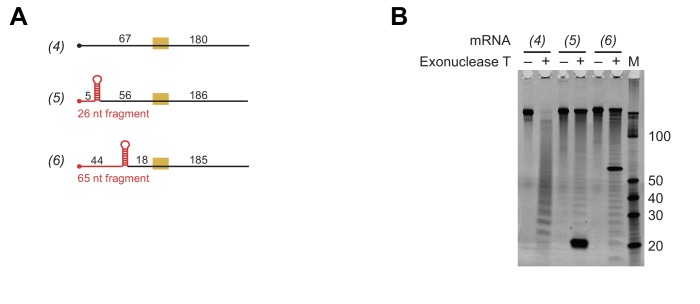
Figure 3—figure supplement 2. Evidence that the designed hairpins in the 5'-UTRs of mRNAs 5 and 6 are formed and that mRNA 4 lacks secondary structure.

Figure 3—figure supplement 2.

(A) RNAs 4–6 used in the study (same as in Figure 3A; shown again here for convenience). The fragments expected to be protected from 3'−5' RNase Exonuclease T digest are indicated in red. (B) RNAs 4–6 were incubated in the presence (+) or absence (–) of the 3'−5' RNase Exonuclease T, at the same temperature (26°C) used in all experiments in this study, for 18 hr. Reactions were resolved on a 15% Tris Borate EDTA Urea gel (4 pmol of total RNA per lane) and stained with SYBR Gold nucleic acid gel stain. ‘M:’ Abnova Small RNA Marker. Marker RNA fragment sizes are indicated to the right of the gel.
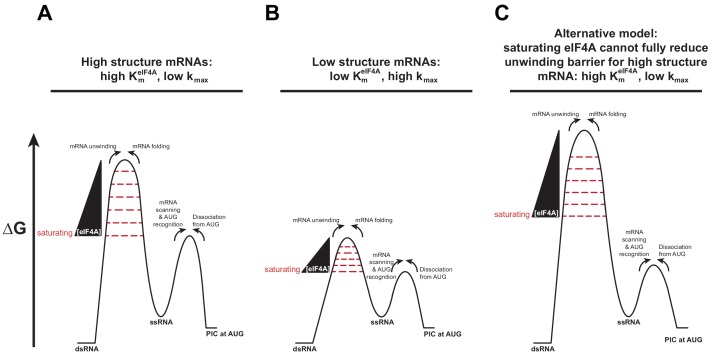
Figure 3—figure supplement 3. A change in the rate-limiting step for mRNA recruitment may be responsible for the effect of mRNA structure on the K1/2eIF4A values.

Figure 3—figure supplement 3.

(A) An mRNA harboring a high degree of structure has a large barrier to mRNA recruitment posed by the need to resolve those structures in order to load the mRNA onto the PIC (left-hand barrier). As the concentration of eIF4A is increased, it decreases the height of this barrier by facilitating the disruption of the structures in the mRNA (wedge and decreasing barrier height). When the barrier posed by structure has been reduced below the level of the right-hand barrier for subsequent steps (e.g., scanning, AUG recognition) the latter, which is not dependent on eIF4A, becomes rate-limiting and the rate of mRNA recruitment plateaus as a function of eIF4A. This situation leads to a high value of K1/2eIF4A. (B) An mRNA with a low degree of structure has a small eIF4A-dependent barrier (left-hand barrier), which is reduced below the level of the barrier for subsequent steps (right-hand barrier) at a lower concentration of eIF4A than in (A). This situation leads to the plateau of the reaction rate occurring at a lower eIF4A concentration, which yields a lower K1/2eIF4Avalue. To explain the different kmax values in these two situations, we posit that the barrier for the second, eIF4A-independent step is lower for mRNAs with little structure than for those with high degrees of structure. This scenario would make sense if this second step involves scanning of the mRNA, which would be inhibited by structures. (C) In an alternative model, which is also consistent with the data, eIF4A cannot lower the barrier for unwinding of mRNAs with high degrees of structure below the level of the eIF4A-indpendent barrier, even at very high eIF4A concentrations, leading to high K1/2eIF4Avalues and low kmax values. In this case, the scenario for mRNAs with low degrees of structure could remain the same as in (B).