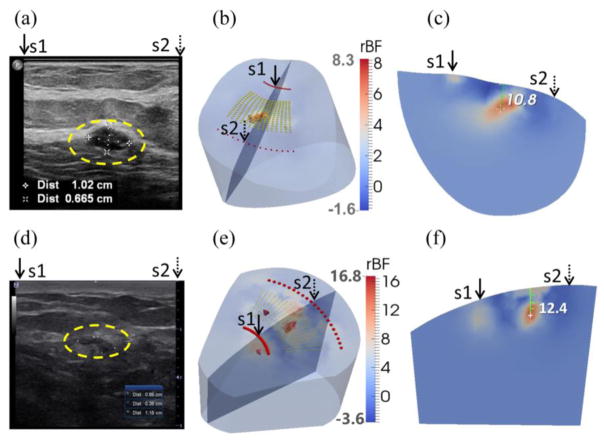
Fig. 10.
Clinical examples of two low-grade carcinomas in situ. (a) Ultrasound image of breast with a tumor (inside the yellow dashed circle) in the first patient. The tumor mass center is located at 19.2 mm beneath the skin surface. (d) Ultrasound image of breast with a tumor (inside the yellow dashed circle) in the second patient. The tumor mass center is located at 13.3 mm beneath the skin surface. (b) and (e) show the reconstructed 3-D tumor blood flow contrasts imaged by the ncDCT in the first and second patients, respectively. For the comparison of ultrasound and ncDCT results, an ultrasound imaging plane along the transducer line and across the overlapped two specific light sources (S1 and S2) of ncDCT (see Fig. 4) is presented in the 3-D reconstructed image. The backgrounds are presented with 30% transparency of the original color clarity. (c) and (f) show the cross-section views through the reconstructed tumor centers, which can be directly compared to the 2-D ultrasound tumor images [(a) and (d)], respectively. This figure is reproduced from Fig. 8 in the reference (He et al., 2015).

