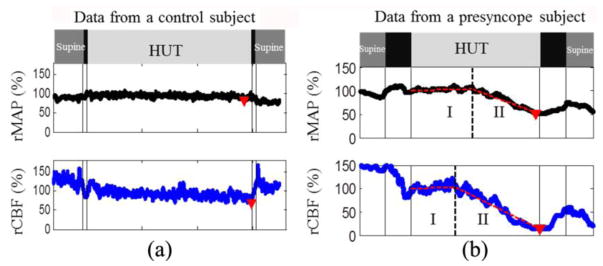
Fig. 5.
Relative changes in mean artery blood pressure (rMAP) and cerebral blood flow (rCBF) from a control subject (a) and a presyncope subject (b) during Head-Up-Tilting (HUT). The solid vertical lines indicate the beginning or ending of tilting up and tilting down. The triangles indicate the minima of rMAP and rCBF during HUT. The two connected dashed lines on top of the raw data (b) demonstrate the two-line fitting results. The dashed vertical lines indicate the break-points separating Stage I and Stage II. This figure is reproduced from the subfigures of Fig. 1 in the reference (Cheng et al., 2014).

