Fig. 7.
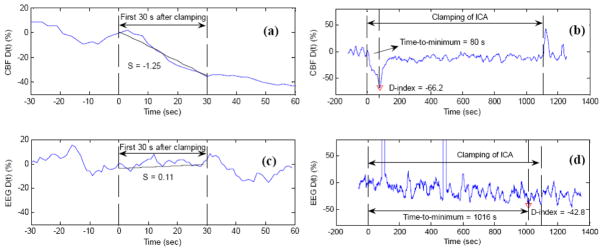
Comparison of DCS and EEG measurement results in a typical patient during carotid endarterectomy (CEA) when the internal carotid artery (ICA) was temporarily clamped. The resulted ischemic status by the ICA clamping was characterized by the slope (S), D-index, and time-to-minimum for both CBF (top panel) and EEG (bottom panel) at the surgical side. Here the slope (S) is the deceasing rate of variable D(t) during the first 30-second clamping period, and D(t) represents the percentage change of variable (CBF or EEG spectral power) at time t, when compared to pre-clamping baseline. The minimum of D(t) during the entire period of clamping is defined as D-index, representing the most severe cerebral hypoperfusion during ICA clamping. The period from the beginning of clamping to the time of D(t) attaining its minimum (D-index) is defined as time-to-minimum. The large negative CBF slope (S = −1.25) during the first 30-second clamping period indicates the rapid CBF decrease due to ICA clamping (a). The time duration of CBF decrease and maximal CBF decrease during the entire clamping period were characterized by time-to-minimum (80 s) and D-index (−66.2%), respectively (b). By contrast, the EEG power changes were small and slow (S = 0.11) (c), and reached its minimum (D-index = −42.8%) in a long period of time (time-to-minimum = 1016 s) (d). This figure is reproduced from Fig. 4 in the reference (Shang et al., 2011b).

