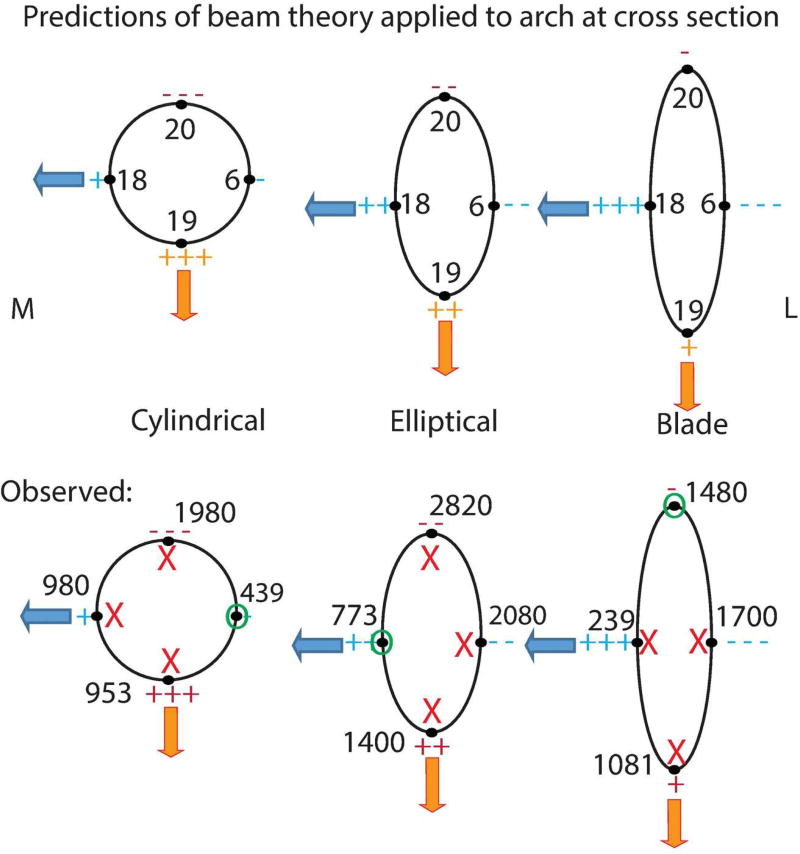
Figure 11.
Predictions of beam theory for different cross sectional shapes compared to strain results measured in FEMs. Top row depicts predictions (as in Figure 3) and bottom row includes strain results in microstrain (either maximum or minimum principal strain). Numbers in top illustrations correspond to sampling locations. “M” is medial and “L” is lateral. Orange arrows represent parasaggital bending and blue arrows represent mediolateral bending. Tension is represented by “+” and compression is represented by “-“ with +, ++ and +++ (−, −−, and −−−) representing least, intermediate and most tension respectively. Bottom row: strains are in microstrain. Red "X' indicates that strains at this location do not match predictions of beam theory. Green "O" indicates that strains at this location do match predictions of beam theory.

