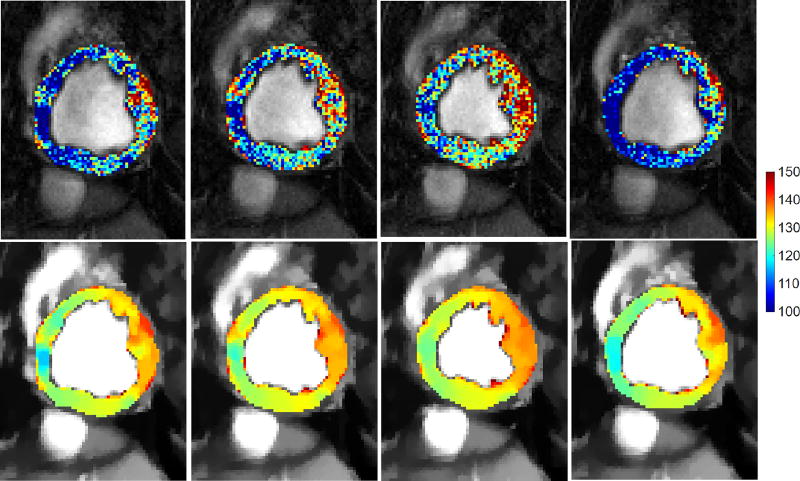
Fig. 4.
Influence of Total Variation based smoothing on different cardiac phases of a healthy subject. Four temporal phases of the same acquisition of a subject before (top) and after pre-processing (bottom), where myocardial intensities have been color-coded to aid visualization. Observe, how myocardial intensities appear smoother and within the same (and shorter) range across the cardiac cycle after TV-based smoothing (bottom row).

