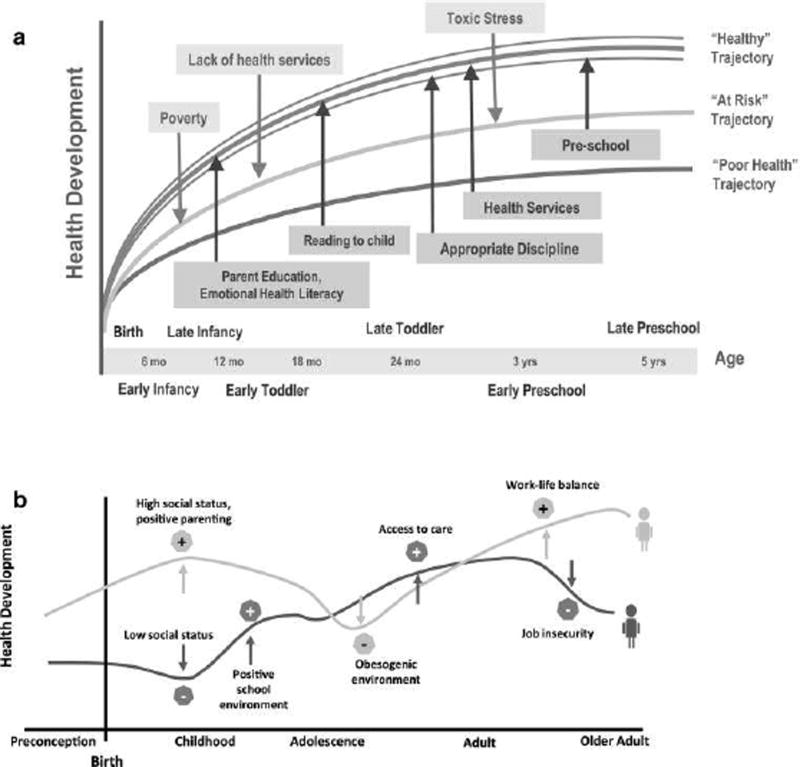
Figure 1.
These two graphics (a and b) illustrate the development of health trajectories based on the impact of various risk, promoting, and protective factors on health development. Graphic a demonstrates how higher or lower health development trajectories are influenced by the relative number and magnitude of risk and protective factors. Graphic b demonstrates how trajectories are not straight, linear, overly determined, or immutable, but can be in a constant state of flux relative to different influences at different points in time. These graphical illustrations of health trajectories challenge the notion that adult disease manifestations have more acute influences; rather, early life course factors begin the health trajectory, influenced by factors along the way. Reprinted with permission from “Lifecourse health development: Past, present, and futures,” by N. Halfon, K. Larson, M. Lu, E. Tullis, & S. Ross, 2014, Journal of Maternal and Child Health, 18(2), p. 352. Copyright 2014 by Springer.

