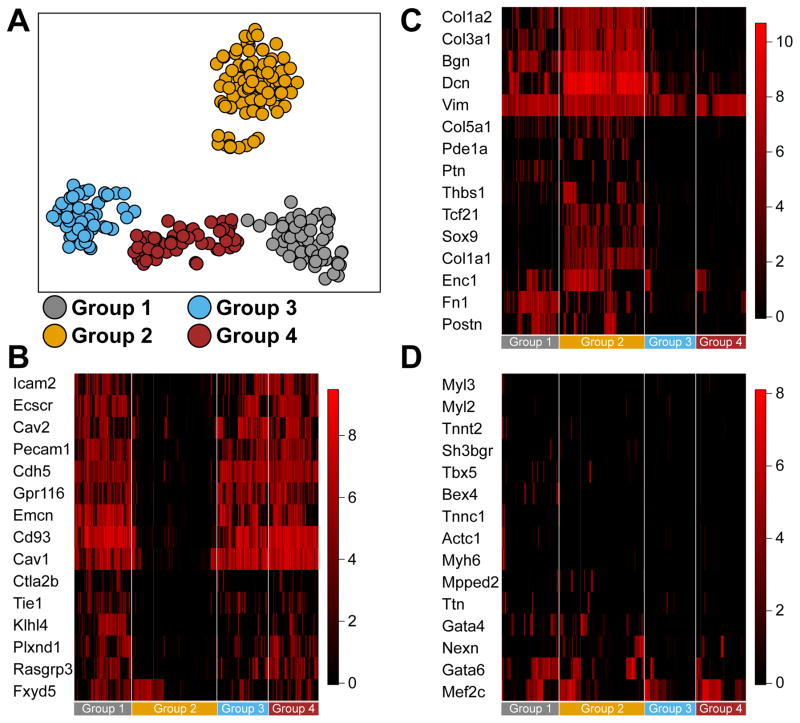
Figure 1. Single cell sequencing of cardiac CD45−c-kit+ cells.
A. Single cell sequencing and clustering of 281 cardiac CD45−c-kit+ cells. Clusters are identified by K-means clustering and indicated by different colors. Each circle represents a single cell. Clusters 1 through 4 are next analyzed for expression of genes indicative of different lineage commitment. B. Gene expression heatmap of 15 genes indicative of endothelial lineage commitment. Groups 1, 3 and 4 show high expression of endothelial lineage genes, while group 2 shows low expression. C. Gene expression heatmap of 15 genes indicative of fibroblast lineage commitment. Group 2 shows high expression of fibroblast lineage genes, while groups 1, 3 and 4 show low expression. D. Gene expression heatmap of 15 genes indicative of cardiomyocyte lineage commitment. No group of cells shows enrichment for cardiomyocyte lineage genes. The overall number of cells that express more than 2 cardiomyocyte markers is very low under baseline conditions.

