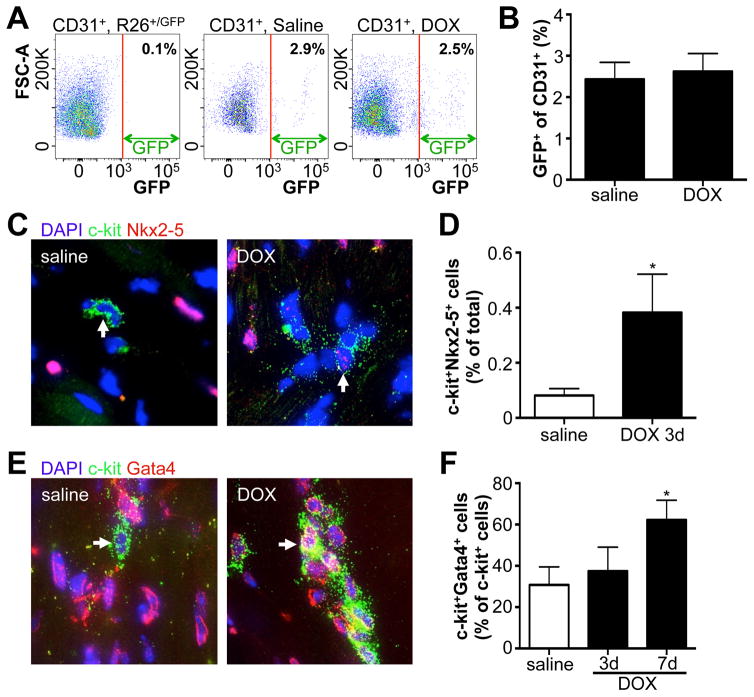
Figure 5. DOX induced expression of cardiac transcription factors in c-kit+ cells.
A. Flow cytometry of CD31+ cardiac cells for GFP fluorescence. Left panel uses CD31+ cells isolated from R-GFP control mice to set the gate. Middle and right panels show CD31+ cells from Kit+/MCM X R-GFP after saline or DOX treatment respectively. B. Quantification of GFP+CD31+ cardiac cells. N=4 and 8 C. Representative immunohistochemistry of cardiac sections for DAPI (blue), C-kit (green) and Nkx2–5 (red) 3 days after saline or DOX injection. D. Quantification of percentage of cells that is positive for both Nkx2–5 and c-kit 3 days after saline or DOX. N=3 and 4, *p<0.05 E. Representative immunohistochemistry of cardiac sections for DAPI (blue), C-kit (green) and Gata4 (red) 7 days after saline or DOX injection. F. Quantification of percentage of c-kit+ cells that is positive for Gata4, three and seven days after saline or DOX. N=4, 4 and 4, *p<0.05

