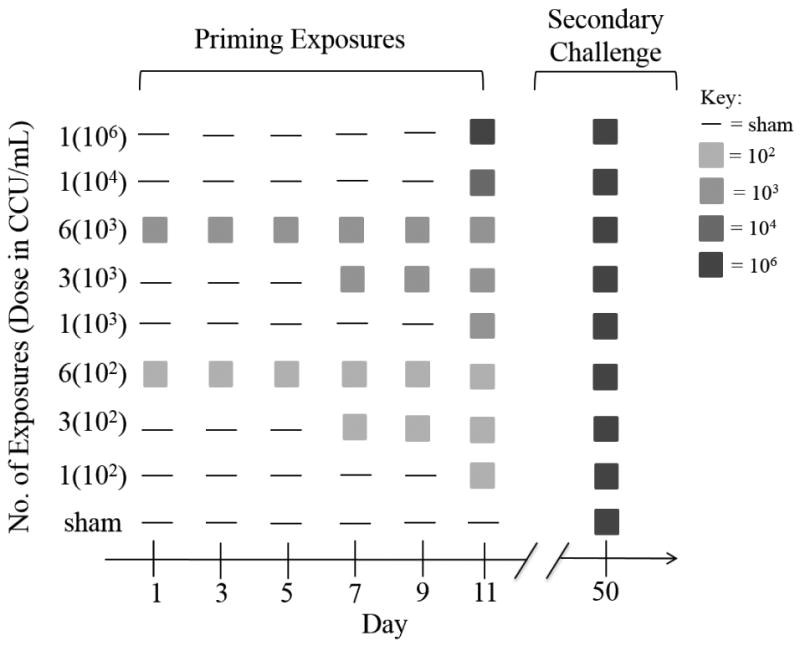
Figure 1.

Experimental timeline for the nine priming inoculation treatments (y-axis). Dose (in parentheses) is expressed as color changing units (CCU) per ml. All priming treatment groups, including the sham priming group, were challenged with a high dose of pathogen 39 days after the last priming treatment.
