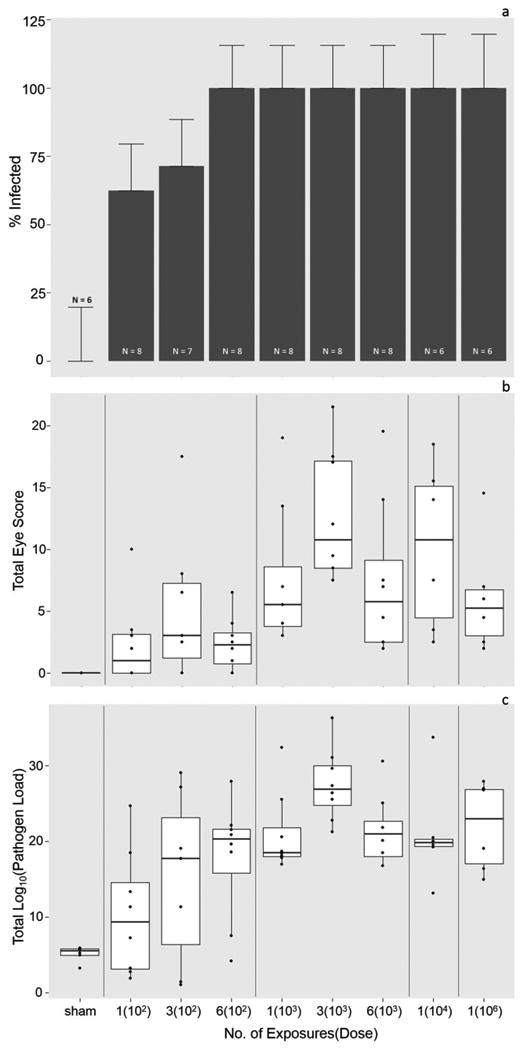
Figure 2.

Probability of infection (a), disease severity (b) and infection severity (c) in response to priming exposures. a) The likelihood of successful infection (Y or N) of Mycoplasma gallisepticum in house finches varied with exposure level. Error bars represent standard error of the proportion infected, and the y-axis extends to 125% to visualize error bars. b) Disease severity increased with priming dose of Mycoplasma gallisepticum, but not with the number of exposures. For visual clarity, here scores (scale 0-3) for both eyes were summed across time-points for each individual to calculate total eye scores for the entire course of primary infection. Each point thus represents a single individual. c) Conjunctival pathogen load increased with priming dose of Mycoplasma gallisepticum, but not with the number of exposures. Again, for visual clarity, total pathogen load includes conjunctival loads summed across primary infection sampling time-points. Each point represents an individual.
