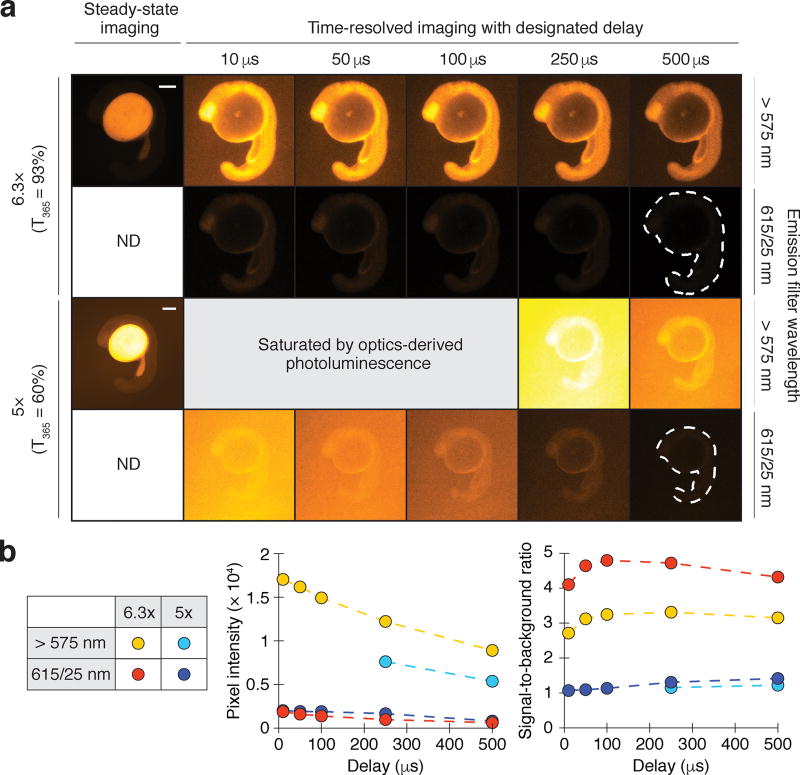
Figure 3. Optics and lanthanide photoluminescence overlap temporally and spectrally.
(a) Zebrafish embryos injected with Eu3+/DTBTA-dextran (30 fmol/embryo) and then imaged by objectives with differing UV transmission efficiencies. Emission filters and time delays were also varied to assess the spectral and temporal properties of the optics-derived luminescence. Representative micrographs of 16-hpf embryos are shown. Scale bar: 200 µm. (b) Left graph: average pixel intensities within the embryos (dashed outlines). Right graph: signal-to-background ratios of the time-resolved micrographs, with background defined as average pixel intensities outside the dashed outlines. ND, not determined.

