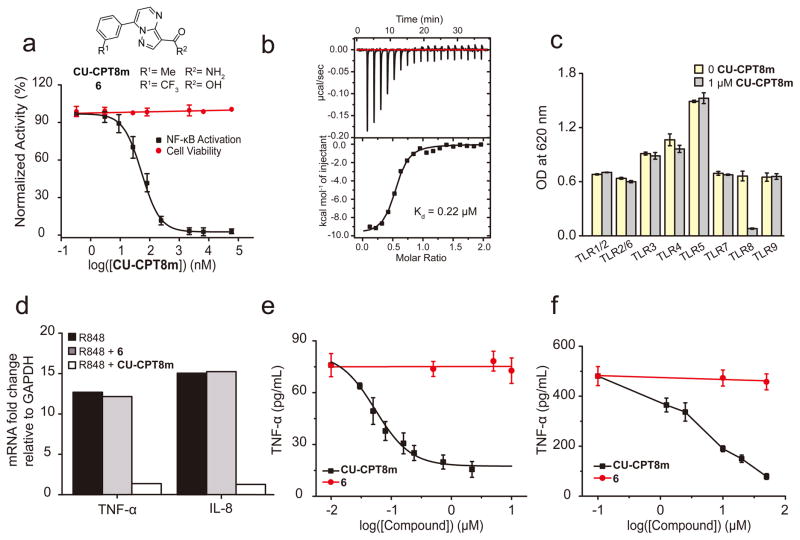
Figure 1. CU-CPT8m potently and selectively inhibited TLR8.
(a) Chemical structures of CU-CPT8m and 6 (negative control), concentration-response curve and dose-dependent cytotoxicity of CU-CPT8m in HEK-Blue TLR8 cell line. Data was normalized to a DMSO control (data are mean ± SD; n = 3 independent experiments). (b) ITC thermogram of CU-CPT8m titrated into hTLR8 to determine binding affinity and stoichiometry (representative of one independent experiment). The raw data are presented on top and the integrated peak areas are shown and fitted below. Mean Kd = 0.22 μM; stoichiometric binding N = 0.5. (c) Specificity test for CU-CPT8m (1 μM) with TLR-specific agonists used to selectively activate different HEK-Blue TLR-overexpressing cells in the presence or absence of 1 μM CU-CPT8m (data are mean ± SD; n = 3 independent experiments). (d) TNF-α and IL-8 mRNA level in R848 treated HEK-Blue TLR8 cells in the presence and absence of 1 μM CU-CPT8m or the negative control, 6 (10 μM). Data are the average quantification of two independent experiments. (e) Dose-dependent response of CU-CPT8m on TLR8-mediated TNF-α production in THP-1 cells with indicated concentration of CU-CPT8m or 6. Data are mean ± SD; n = 3 independent experiments. (f) Dose-dependent response of CU-CPT8m or 6 on TLR8-mediated TNF-α production in PBMC cells induced by 1 μg/mL R848. Data are mean ± SD; n = 3 independent experiments.

