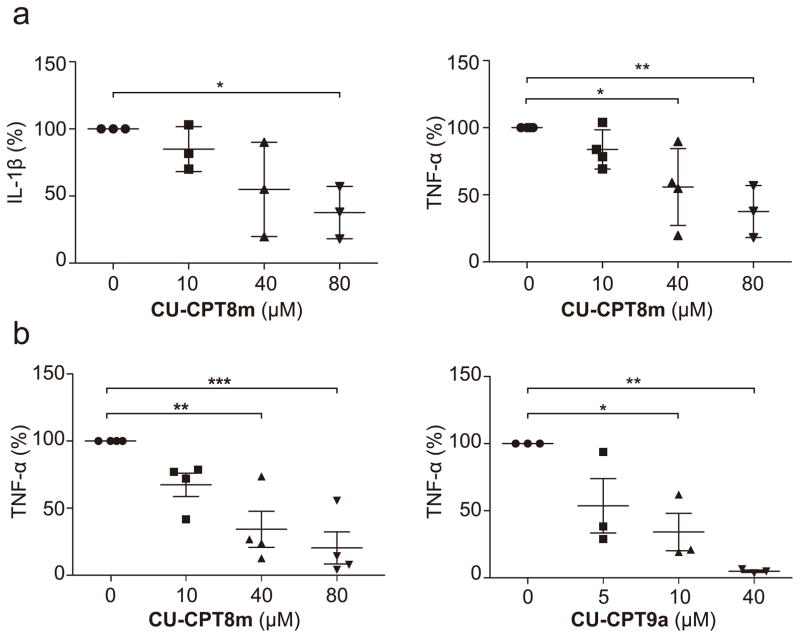
Figure 5. TLR8 inhibitors suppress the proinflammatory cytokine production in multiple human primary cells derived from different patients.
(a) Effect of CU-CPT8m treatment on the production of IL-1β and TNF-α in synovial cell harvested from OA patients. The graph represents percent change 24 h after inhibitor treatment as compared to untreated cells from the same patient. Each data point represents an independent sample read. Center lines indicate means, and whiskers indicate ± SD. (n = 3 independent experiments for IL-1β, and n = 4 independent experiment for TNF-α, P-values were determined using one-way ANOVA, *P < 0.05, **P < 0.01). (b) Effects of CU-CPT8m and CU-CPT9a treatment on the production of TNF-α in PBMC cells harvested from RA patients. Each data point represents an independent sample read. Center lines indicate means, and whiskers indicate ± s.e.m. (n = 4 independent experiments for CU-CPT8m, and n = 3 independent experiments for CU-CPT9a, P-values were determined using one-way ANOVA, *P < 0.05, **P < 0.01, ***P < 0.001).

