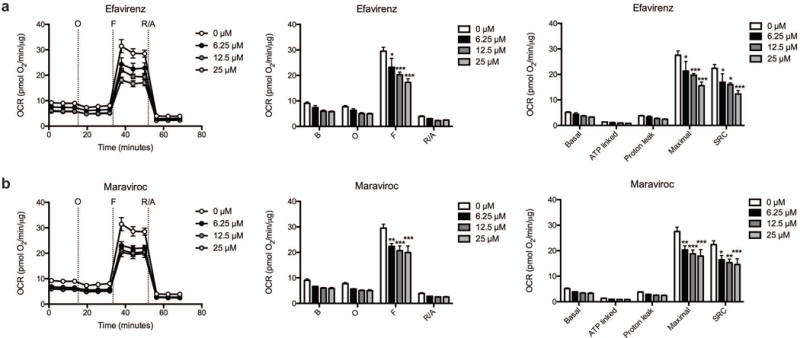
Fig. 6.

Dose-dependence of the efavirenz and maraviroc induced respiratory alterations. The OCR was measured in striatal nerve terminals exposed to vehicle or 6.25, 12.5, and 25 μM (a) efavirenz or (b) maraviroc for 2 hours. Left: Graphical representation of the relative OCR responses over time expressed as a percent response from baseline (third measurement, before oligomycin injection); sequential additions are indicated as O (5 μM oligomycin), F (4 μM FCCP), and R/A (2 μM rotenone and 2 μM antimycin A). Middle: Quantification of the mean OCR in striatal nerve terminals exposed to (a) efavirenz or (b) maraviroc is shown for respiration under baseline conditions (B) and after the sequential additions (O, F, and R/A). Right: Mitochondrial respiratory parameters calculated from the OCR in striatal nerve terminals exposed for 2 hours to vehicle or 25 μM (a) efavirenz or (b) maraviroc is shown for basal mitochondrial respiration (B minus R/A), ATP linked respiration (B minus O), proton leak (O minus R/A), maximal mitochondrial respiration (F minus R/A), and SRC (F minus B). Data (mean ± SEM; n = 3) were compared with those for vehicle control and the complete data set was analyzed by ANOVA with Bonferroni post-hoc test; significance versus control: *p < 0.05, **p < 0.01, ***p < 0.001. For ease of visualization the data is presented with the vehicle control compared to each ARV drug individually.
