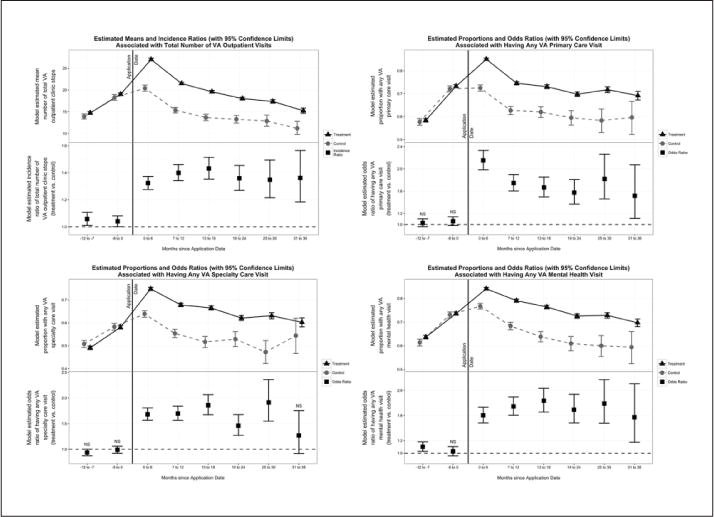
Figure 5. VA outpatient, primary care, specialty care, and mental health care.

Note. VA = Veteran Affairs. The top panel of the top left figure represents the model-estimated mean visit count in each group (treatment and control) at each 6-month interval, with 95% confidence intervals at each time point. The bottom panel of the figures represents the model-estimated incidence density ratio, or rate ratio, comparing the mean number of visits of someone in the treatment group receiving that type of care compared with a similar individual in the control group. An incidence density ratio of 1.0 indicates no difference between groups; 95% confidence intervals are provided at each time point, and periods without statistically significant differences are denoted with “NS.” All other figures can be interpreted as those in Figure 4.
