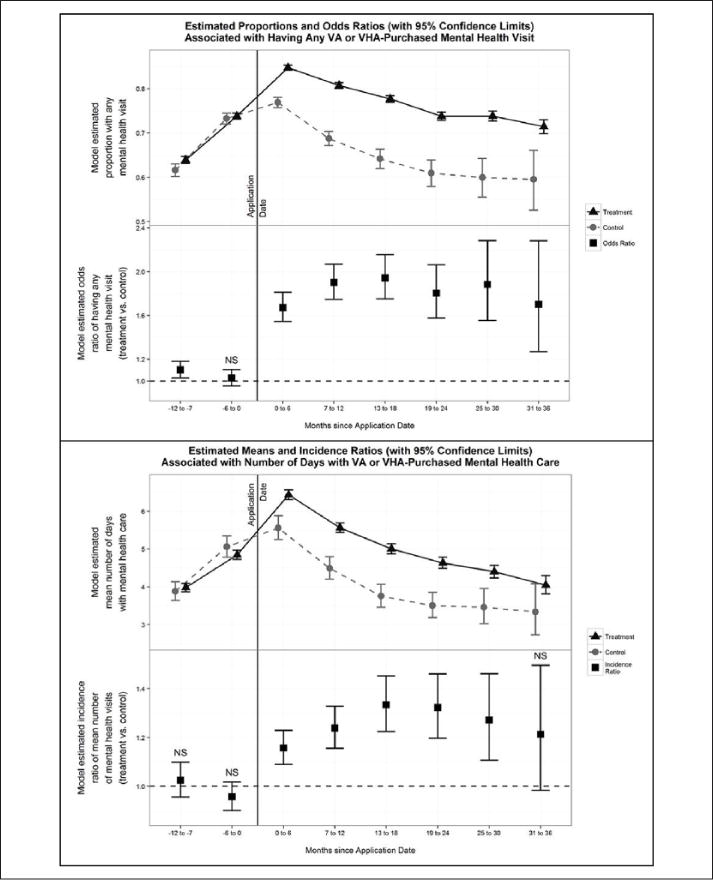
Figure 6. VA or VHA-purchased mental health care.

Note. VA = Veteran Affairs. To interpret the top half of the figure: The top panel of the figure represents the model-estimated proportion in each group (treatment and control) receiving any VA or VA-purchased mental health care at each 6-month interval, with 95% confidence intervals at each time point. The bottom panel of the top half represents the model-estimated odds ratios, comparing the odds of someone in the treatment group receiving such care compared with a similar individual in the control group. To interpret the bottom half of the figure: The top panel of the bottom figure represents the model-estimated mean visit count in each group (treatment and control) at each 6-month interval, with 95% confidence intervals at each time point. The bottom panel of the bottom figure represents the model-estimated incidence density ratio, or rate ratio, comparing the mean number of visits of someone in the treatment group receiving VA or Veterans Health Administration–purchased mental health care compared with a similar individual in the control group.
