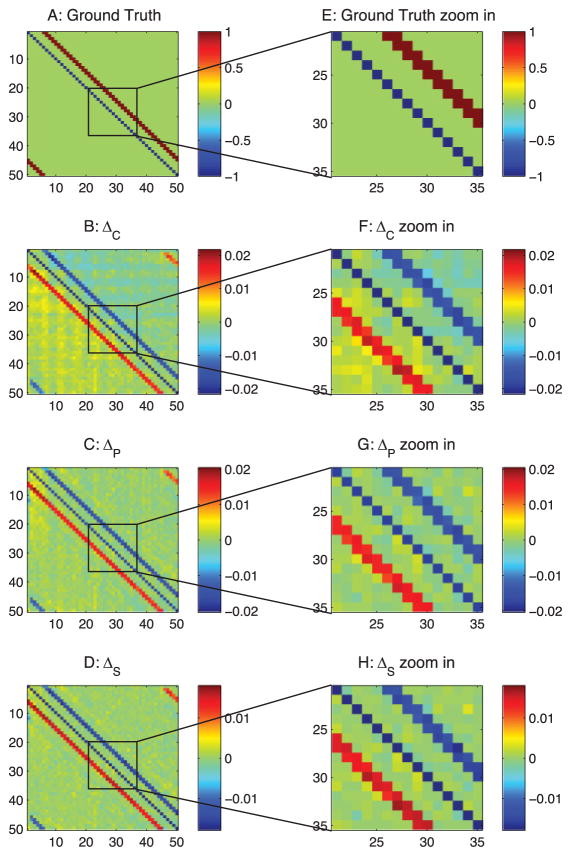
Figure 11.
Analysis of the simulated LFP data with differential covariance-based methods. The color in panels B, C, D, F, G, and H indicates the direction of the connections. For element Ai j, a warm color indicates i is the sink and j is the source—i ← j. A cool color indicates j is the sink and i is the source—i → j. (A) Ground-truth connection matrix. (B) Estimation from the differential covariance method. (C) Estimation from the partial differential covariance method. (D) Estimation from the sparse + latent regularized partial differential covariance method. (E) Zoom-in of panel A. (F) Zoom-in of panel B. (G) Zoom-in of panel C. (H) Zoom-in of panel D.

