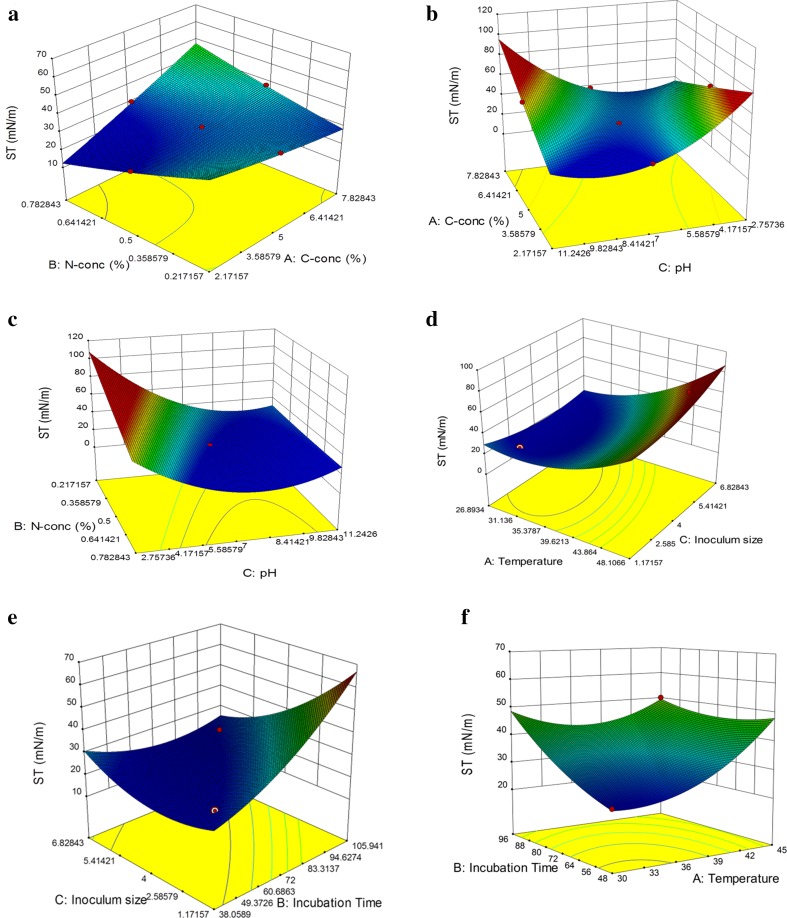
Fig. 3.
Response surface plot showing the interactive effect of two factors on surface tension of media. a C-source% and N-source%, b C-source% and pH of media, c C:N-source% and pH of media, d temperature and inoculum size, e inoculum size and incubation time, f incubation time and temperature. The plots generated using the data obtained from Table 2

