Figure 1.
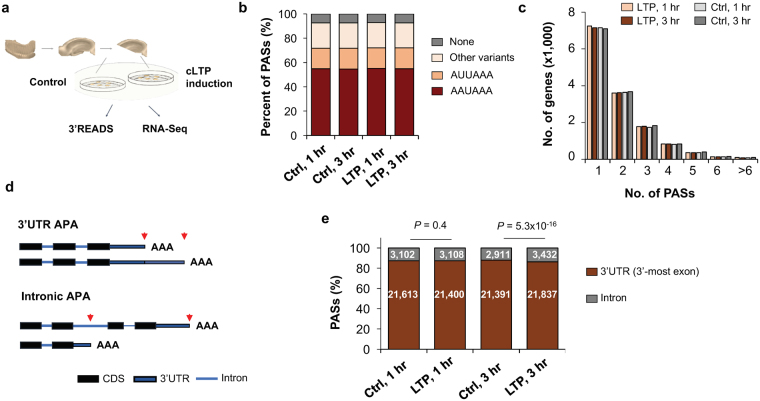
Analysis of APA in LTP. (a) Experimental design. RNAs from chemical LTP (cLTP)-induced and time-matched control hippocampal slices were subjected to 3′READS+ analysis to examine APA, or RNA-seq for gene expression. (b) Distribution of the A[A/U]UAA element in identified poly(A) sites (PASs). Percentage of PASs associated with either AAUAAA, AUUAAA, other variants of A[A/U]UAAA, or not associated with any A[A/U]UAAA element are shown for each sample group. (c) Number of PASs identified per gene. Genes with only one PAS have the highest frequency and the majority of genes displayed APA in the hippocampal samples analyzed. (d) Diagram showing 3′UTR APA (top) and intronic APA (bottom). 3′UTR APA isoforms have alternative 3′ UTRs resulting from the choice of different PASs in the 3′UTR. Two PASs are shown, i.e., proximal PAS and distal PAS. Intronic APA isoforms have different 3′UTRs as well as coding sequences (CDS). (e) Distribution of PASs in different regions of the mRNA: 3′UTR (in 3′-most exon only) vs. upstream intron. Change of PAS distribution during LTP is observed 3 hr post LTP induction. Number of PAS in each region is specified in each bar. P-values (Binomial test) indicate difference in fractions of 3′UTR PASs and intronic PASs in LTP vs. control samples.

