Figure 3.
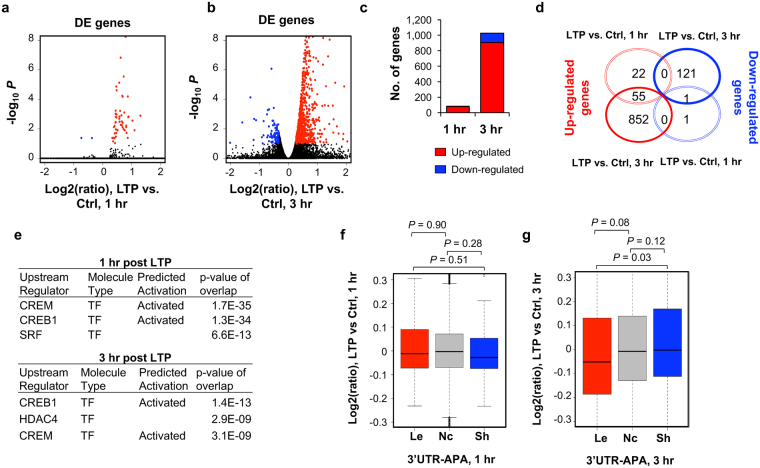
Regulation of gene expression after LTP induction. Differentially expressed (DE) genes 1 hr (a) or 3 hr (b) post LTP induction, as determined by RNA-seq. X-axis, log2(ratio) of gene expression (LTP vs Control); Y- axis, −log10 P (DESeq). DE genes were selected based on expression change >20% and FDR <0.1. Genes with upregulated expression are highlighted in red and those with downregulated expression in blue. Black dots represent genes without significant regulation. (c) Bar graph summarizing DE genes shown in (a) and (b). (d) Venn diagram comparing DE genes at 1 hr LTP and 3 hr LTP. (e) IPA upstream regulator analysis for significantly regulated genes. This data is generated through the use of Ingenuity Pathways Analysis, a web-delivered application (www.Ingenuity.com). (f) and (g) Gene expression regulation vs. LTP-induced 3′UTR-APA regulation. Box plots showing the log2(ratio) of gene expression, LTP vs. Ctrl, for genes with 3′UTR lengthened (Le), shortened (Sh) or no change (Nc) at 1 hr (f) or 3 hr (g) post LTP induction. Only genes with significant 3′UTR APA regulation (those from Fig. 2) were included. P-values (Wilcoxon rank sum test) indicate difference between gene groups.

