Figure 5.
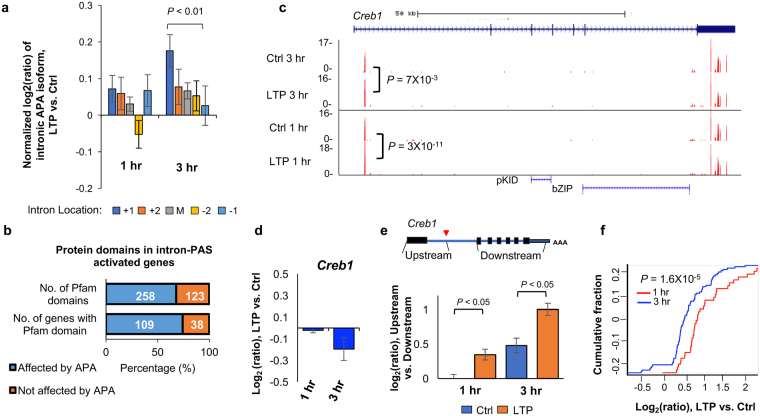
Characteristics of intronic APA after LTP induction. (a) Normalized expression changes of intronic PAS isoforms. Intronic PAS isoforms were divided into five groups based on the intron location where PAS resides, i.e., first (+1), second (+2), last (−1), second to last (−2), and middle (between +2 and −2 introns). Expression changes are expressed as log2(ratio), LTP vs. Ctrl. Only genes with ≥4 introns and only PAS isoforms with ≥2 reads were used for analysis. Values for five intron groups were normalized by mean-centering. Error bars are standard error of mean. P-value (Wilcoxon rank sum test) indicating difference between first and last intron values is shown. (b) Protein domains that can potentially be removed or truncated by intronic PAS activation. Number of pfam domains that can be removed or not removed by intronic APA is indicated in the upper bar, and number of genes that contain domains removed or not removed by intronic PAS activation is indicated in the lower bar. (c) An example gene Creb1, which displayed significant intronic PAS activation. Gene structure is shown on top and peaks for PASs are shown in UCSC genome browser tracks. P-values based on comparison of intronic PAS and 3′UTR PAS (DEXSeq) are indicated. Pfam domains are indicated. Reads are acquired by combining samples. (d) Gene expression change of Creb1 after LTP. (e) Expression changes based on RNA-seq reads mapped to different regions of Creb1. Schematic of Creb1 is shown on the top, and log2(ratio) from indicated region is shown in a bar plot. Two regions were analyzed, including the region from transcription start site to the intronic PAS, and the region from the second to the last exons. (f) Gene expression changes (LTP vs. Ctrl) of CREB1 target genes obtained from the IPA database. The blue curve corresponds to 81 target genes in the 3 hr post LTP samples, whereas the red corresponds to 37 target genes in the 1 hr post LTP samples.

