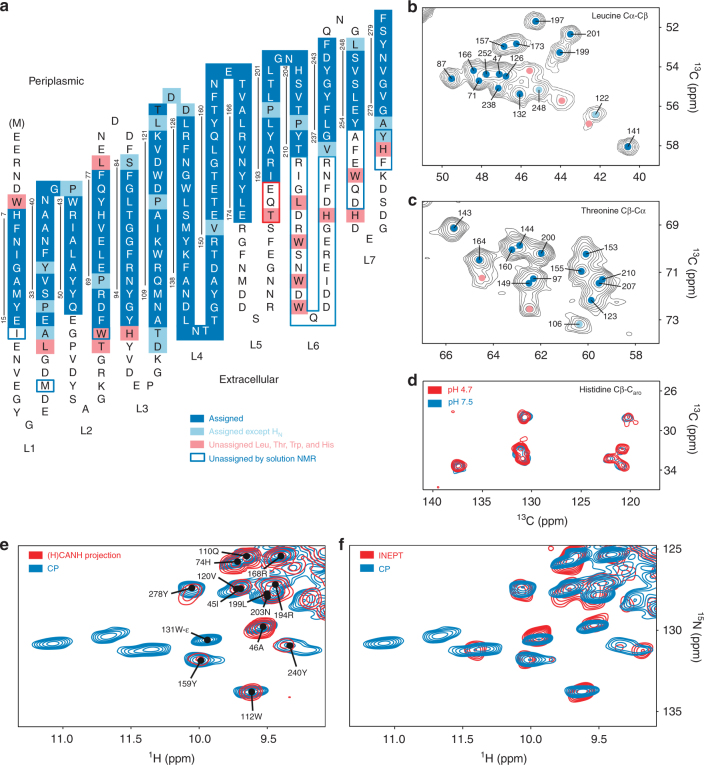
Fig. 1.
Resonance assignment and OmpG topology. Assigned residues are indicated in blue. a For residues in light blue, the 1HN shift is unknown but partial carbon assignment was obtained. Pink indicates unassigned residues as discussed in the text. Residues in blue frames do not show signals in solution NMR spectra and residues in the red frame were assigned by solution NMR but not solid-state NMR, see text. Vertical lines indicate the β-strands with residue numbers. b–d Spectral regions of 13C–13C correlation spectra comprising Cα–Cβ peaks of b leucine in the GAVLS(W) sample (20 ms DARR), c threonine in a DARR spectrum of the 1,3-TEMPQANDSG sample (50 ms mixing), and d histidine in a 50 ms DARR spectrum of the GANDSH(LV) sample. For the peaks indicated by pink dots in these 13C–13C spectra, no strip could be found in the 1H-detected 3D spectra. e, f Overlays of a CP-based 1H–15N-correlation (blue) comprising the region of Trp side chain cross peaks with the projection of the CANH spectrum (e) and an INEPT-based HSQC (f)

