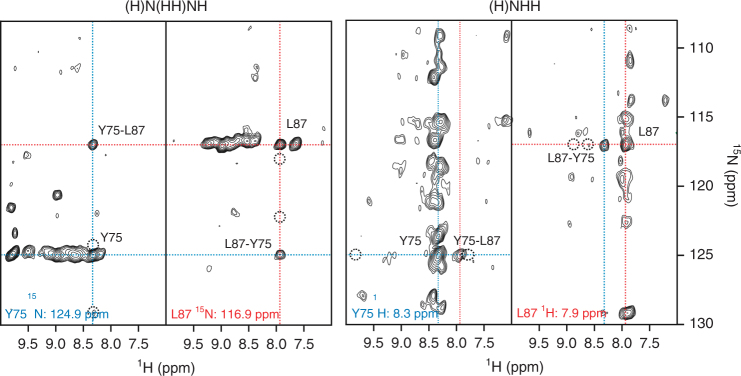
Fig. 2.
Set of two planes from the 3D (H)NHH and (H)N(HH)NH spectra. Strips taken at the 15N chemical shifts of Y75 (left) and L87 (right) from the (H)N(HH)NH and (H)NHH spectra, respectively. The proton–proton cross-peak pattern is indicative of cross-strand hydrogen bonding between the backbone amide and carbonyl groups of tyrosine 75 and leucine 87. Red lines correspond to the 1H and 15N chemical shifts of L87. Blue lines correspond to the 1H and 15N chemical shifts of Y75. A total of four cross peaks are present at the intersections of red and blue lines. Dotted circles indicate positions of potential sequential cross peaks (see text)

