Fig. 6.
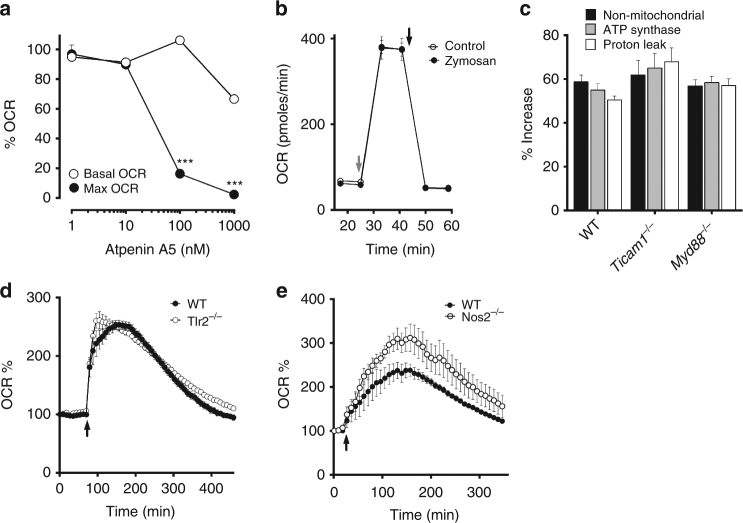
The metabolic switch in peritoneal tissue-resident macrophages is independent of nitric oxide and TLR signalling. a Line graph showing relative changes in oxygen consumption rate (OCR) vs atpenin A5 dose in peritoneal tissue-resident macrophages (pTRMØ). Data are from a single experiment (n = 5–6 separate wells per group), but the difference between basal and maximal OCR changes represents at least 3 experiments. b Line graph showing OCR vs time in pTRMØ. Cells were treated with or without zymosan (50 μg/ml, 2 h) before metabolic flux analysis; cell membranes were permeablised and rotenone (200 nM) added, succinate (20 mM) was added at the grey arrow, and atpenin A5 (1 μM) was added at the black arrow. Data represent at least two independent experiments and shows 6 separate wells per group. Data a, b were analysed by paired two-way ANOVA with Sidak’s post-tests. c Graph showing the increase in mitochondrial parameters from WT, MyD88−/− and Ticam1−/− pTRMØ calculated by comparing mock and zymosan treated samples as seen in Fig. 5b. Data show n = 6 separate wells per group from one experiment. d Graph showing OCR vs time, zymosan was added to wild-type (WT) and Tlr2−/− pTRMØ at the arrow indicated. Data show n = 5 separate wells per group from one experiment. e Graph showing OCR vs time, zymosan was added to wild-type (WT) and Nos2−/− pTRMØ at the arrow indicated. Data in the left panel show n = 5 separate wells per group pooled from two experiments. All error bars denote mean ± SEM

