
FIGURE 2.
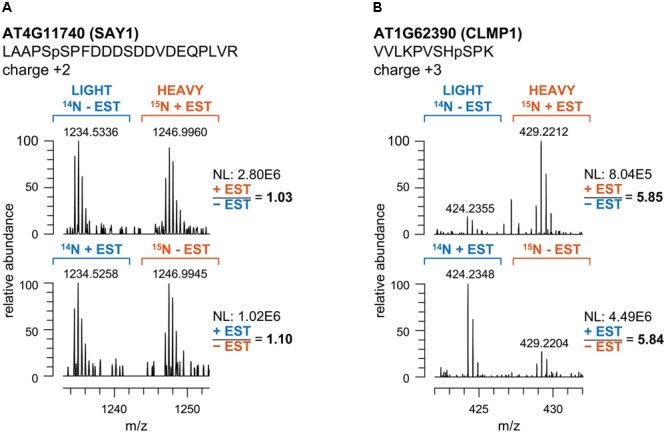
Quantitative analysis of the intensity ratios of labeled and unlabeled peptide pairs. (A) Mass spectra of the phosphopeptide LAAPSpSPFDDDSDDVDEQPLVR mapping to AT4G11740 (SAY1) in tandemMOAC extracted samples of reciprocally14N- and 15N-labeled seedlings treated with ethanol as a control (-EST) or with β-estradiol (+EST). m/z represents the ratio of ion mass over the charge of each phosphopeptide ion. (B) Same as in (A) but spectra correspond to the VVLKPVSHpSPK phosphopeptide of AT1G62390 (CLMP1). NL, normalized intensity level (counts per second).