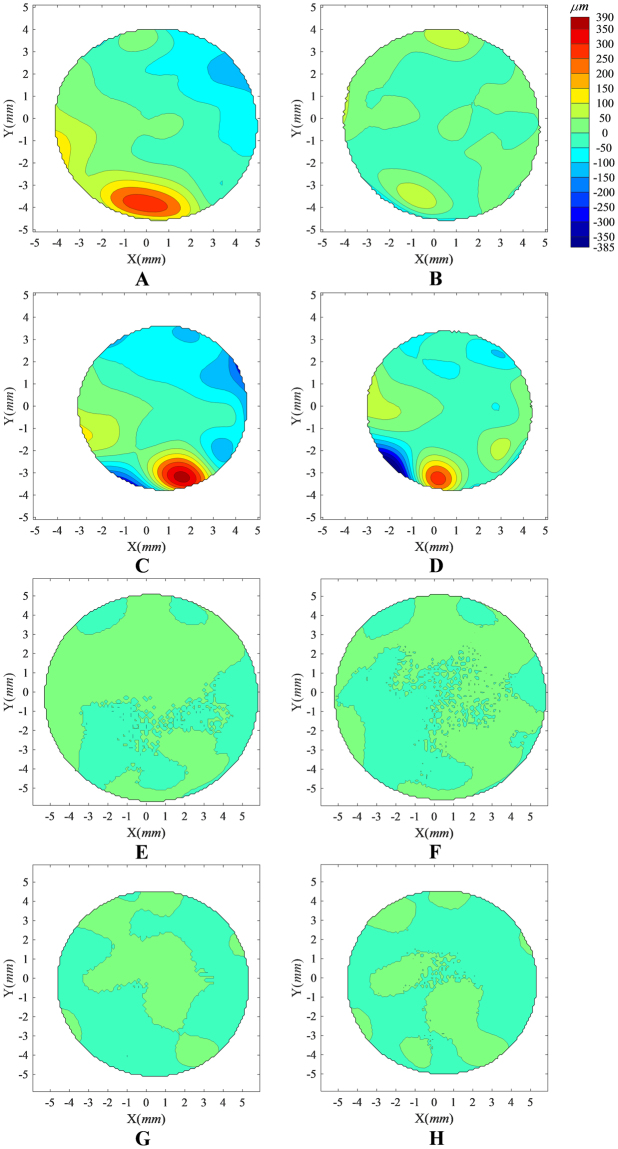
Figure 1.
Distribution of elevation differences between successive corneal topography maps recorded before and after elimination of misalignment using ICP algorithm. The analysis was carried out for a randomly-selected KC case (A–D) and a gender- and age-matched (age difference less than 5 years) Normal case (E–H). Contour maps (A,B,E,F) show the elevation differences in the common region of two successive anterior corneal topographies recorded before (A,E) and after (B,F) elimination of misalignment, while contour maps (C,D,G,H) show corresponding elevation differences in the common region of posterior topographies recorded before and after elimination of misalignment. The eight contour maps share the same colour scale (upright in μm). Before ICP correction of misalignment in the KC case, the RMS of fit error was 87.11 μm for both anterior and posterior surfaces, considered simultaneously, and reduced to 52.39 μm following the ICP correction. This can be compared to the Normal case where the RMS of fit error before ICP correction was 9.09 μm for both anterior and posterior surfaces, considered simultaneously, and reduced to 6.64 μm following the ICP correction.

