Fig. 1.
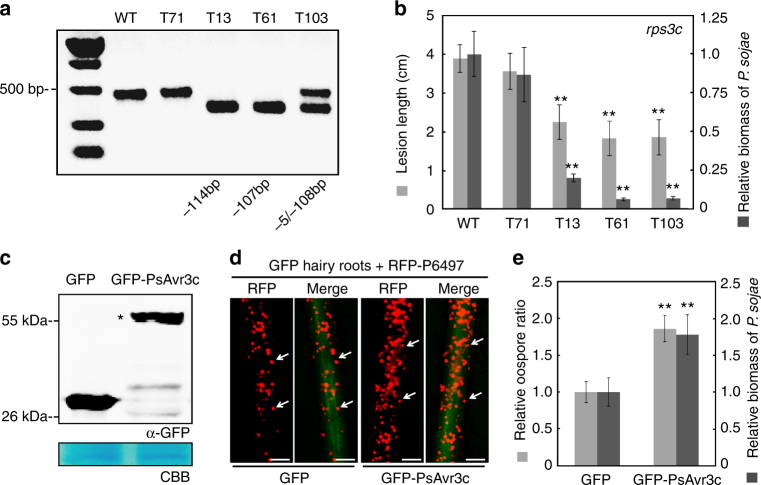
Effector gene PsAvr3c is required for full virulence of P. sojae. a Knockout PsAvr3c gene by CRISPR/Cas9. The agarose gel shows a PCR result of PsAvr3c loci from individual P. sojae mutants. Mutants T13 and T61 are homozygous, whereas T103 is a heterozygote. WT represents wild-type P. sojae strain P6497. The line T71 is a transformant without PsAvr3c editing events. b Measurements of lesion lengths and relative biomass on susceptible soybean (rps3c). Means and standard errors of lesion lengths from six replicates are shown in light gray (**P < 0.01; one-way ANOVA). For relative biomass quantification, the ratio of P. sojae DNA compared with soybean DNA was measured at 48 hpi. Means and standard errors of biomass from three replicates are shown in dark gray (**P < 0.01; one-way ANOVA). c Immuno-blot analysis of GFP-PsAvr3c and GFP in soybean (rps3c) hairy roots. The position of GFP-PsAvr3c protein band is indicated by asterisk. The loading control gel was stained with Coomassie brilliant blue (CBB) to visualize protein. d Overexpression of GFP-PsAvr3c in soybean (rps3c) hairy roots promotes infection. Transformed hairy roots were selected based on the green fluorescence. The hairy roots expressing GFP or GFP-PsAvr3c were inoculated with P. sojae strain P6497 expressing RFP. The P. sojae oospores were photographed at 48 hpi. The oospores were indicated with arrows. Three independent experiments gave similar results. Scale bars represent 0.25 mm. e Statistics analysis and relative biomass quantification of (d). Relative oospore ratio is illustrated in light gray. Means and standard errors from different replicates are shown (**P < 0.01; one-way ANOVA, n = 10). Relative biomass quantification data is shown in dark gray with means and standard errors from six replicates (**P < 0.01; one-way ANOVA)

