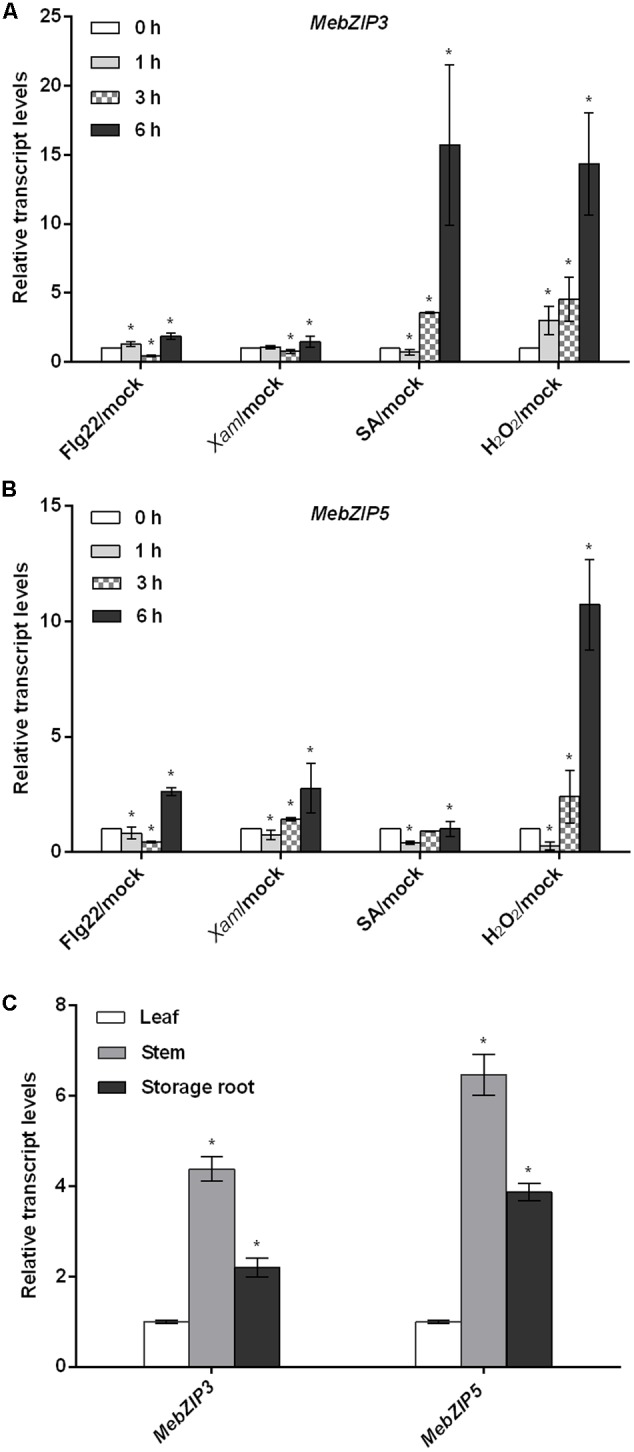
FIGURE 1.

The expression patterns of MebZIP3 and MebZIP5. (A,B) The transcript levels of MebZIP3 (A) and MebZIP5 (B) in response to different treatments. For the assay, cassava leaves were sprayed with water (mock), or 10 μM flg22, or 100 μM SA, or 10 mM H2O2, or syringe infiltrated with 10 mM MgCl2 (mock) or 108 cfu ml-1 of Xam for 0, 1, 3, and 6 h for sample harvest. (C) The transcript levels of MebZIP3 and MebZIP5 in cassava leaf, stem and storage root. Asterisk symbols (∗) indicting the significant differences at p < 0.05.
