FIGURE 7.

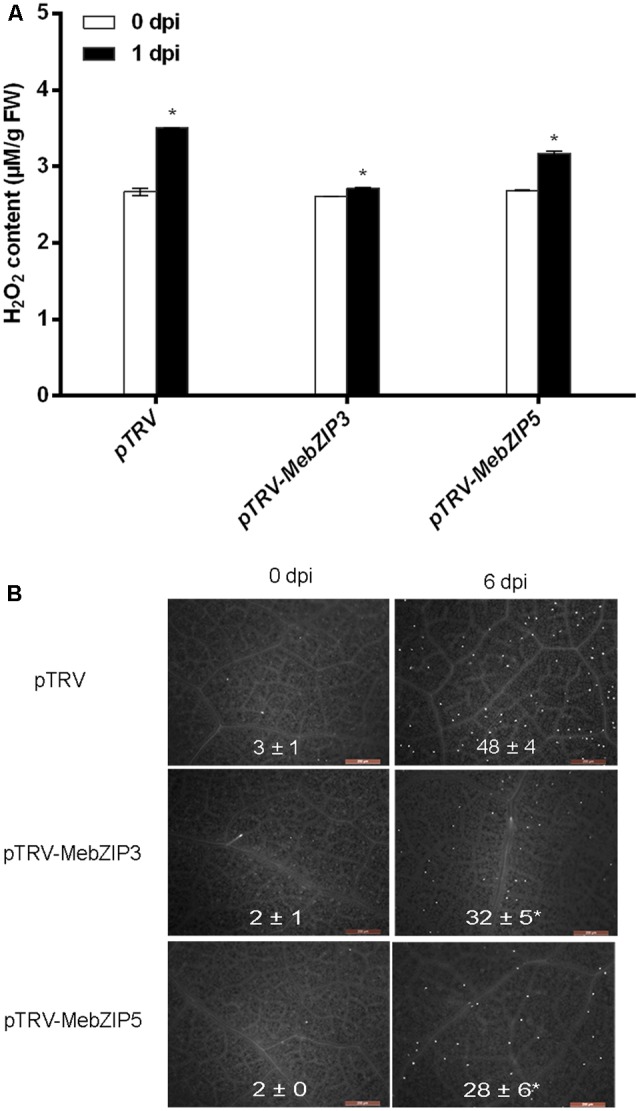
Silencing of MebZIP3- and MebZIP5 regulates callose depositions and ROS level. (A) Quantification of H2O2 in plant leaves. (B) The visualization and quantification of calloses in plant leaves. White dots in the figures indicate callose depositions in plant leaves, and the average data was shown. At least 15 cassava leaves were assayed for every biological repeat, and at least three biological repeats were performed. Asterisk symbols (∗) indicting the significant differences in comparison to vector transformation at p < 0.05.
