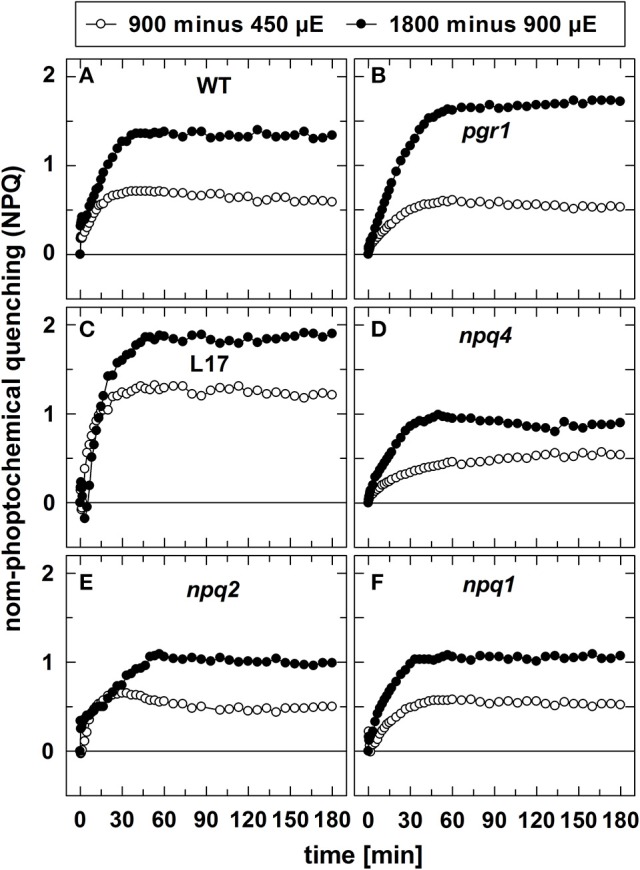
Figure 2.

Differences in NPQ induction upon increase of light intensities. To visualize the differences in NPQ induction upon increase of the actinic light intensity from either 450 to 900 μE or from 900 to 1,800 μE, the differences of the respective curves shown in in Figure 1 were plotted for all genotypes. (A) WT, (B) pgr1, (C) L17, (D) npq4, (E), npq2, and (F) npq1 plants.
