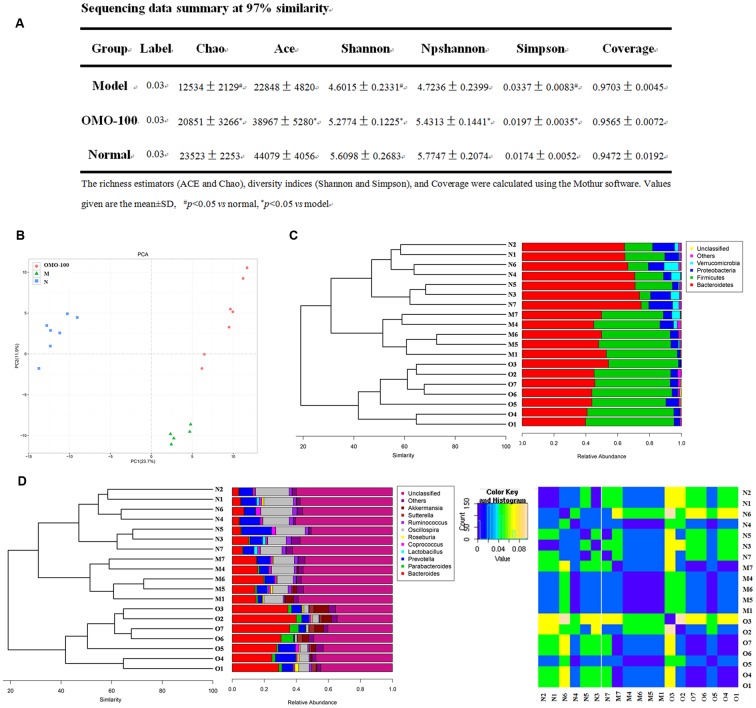
FIGURE 2.
Effects of OMO on gut microbiota in D-galactose-induced deficient rats. (A) Sequencing data summary at 97% similarity. (B) Results of PCA. (C) Classification and abundance of cecal contents at the phylum level. (D) Classification and abundance of cecal contents at the genus level, and the beta diversity. The graph N is normal group; M is model group; O is OMO-100 mg, high-dose group that received D-galactose (100 mg/kg/d) i.p., and gavage at a dosage of 100 mg/[kg⋅d] in OMO. Values are the means of six independent experiments (n ≥ 5).

