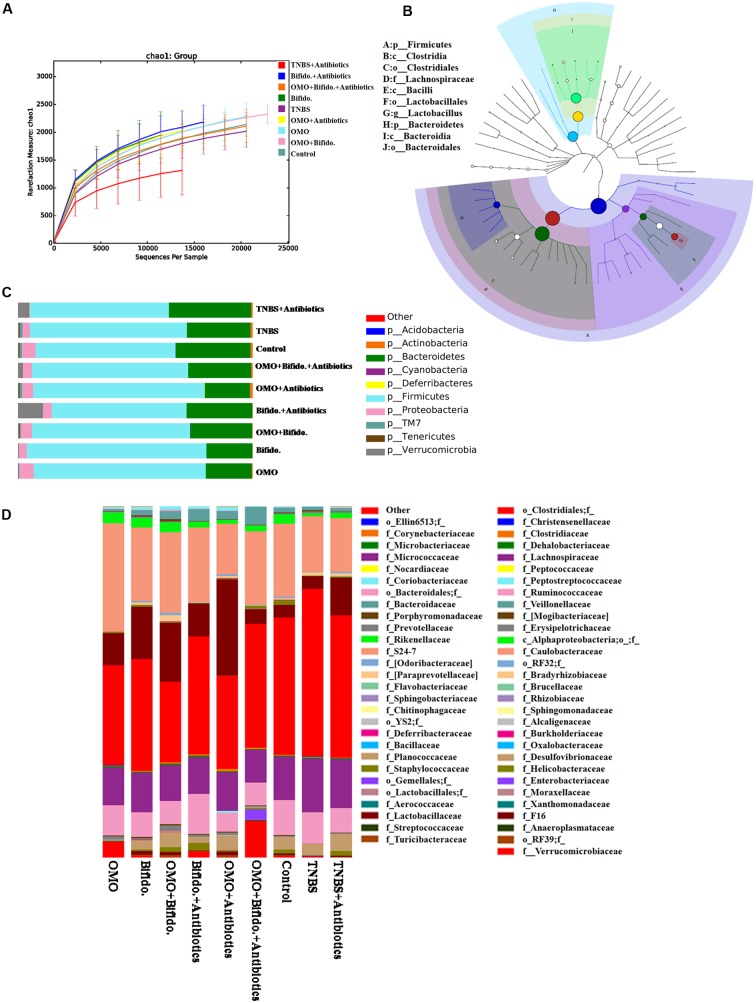
FIGURE 7.
Effects of OMO on the microbiota of cecal contents in high-dose broad spectrum antibiotics and TNBS-induced IBD mice. (A) The graph represents the rarefaction curve. (B) The dominant species classification tree. (C) The classification and abundance of cecal contents at the phylum level. (D) The classification and abundance of cecal contents at the family level. Values are the means of six independent experiments.

