Figure 1.
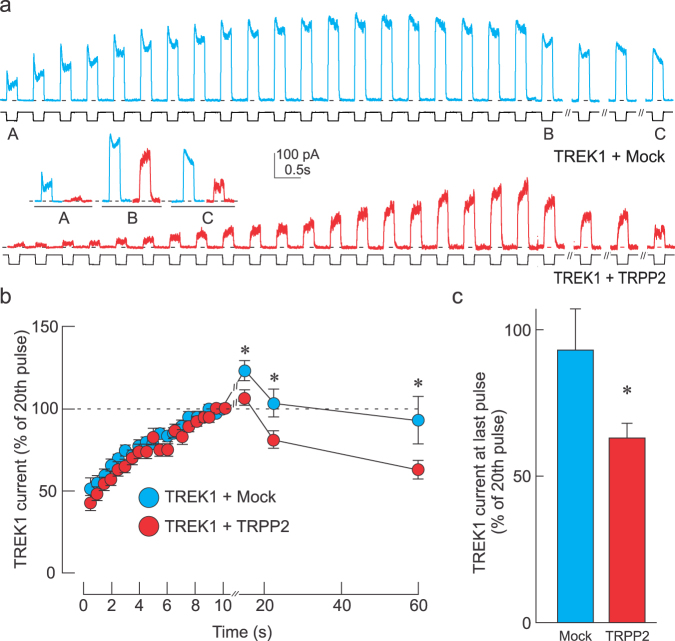
TRPP2 accelerates cytoskeletal inhibition of TREK1. (a) Representative traces showing mechanically-elicited TREK1 currents in cells exposed to a −70 mm Hg pressure pulse at 2 Hz and after 2 s, 15 s, and 30 s of rest. Cells were co-transfected with Mock (blue trace) or TRPP2 (red trace)-containing plasmids. Insets labeled A, B and C represent magnifications of the original trace before (A), at the 20th pulse (B), and at the last pulse (C). (b) Normalized mechanically-evoked TREK1 current (mean ± s.e.m.) during (0–10 s) and after (10–57 s) the pressure pulse train in TRPP2 (n = 38) expressing and Mock (n = 40) cells. *Indicates significant difference from Mock-transfected group, p < 0.05; Two-way ANOVA with Tukey’s post-hoc test. (c) Recovered TREK1 current inhibition at 47 s post pressure pulse train showing a significant increase in TREK1 current inhibition when TRPP2 is expressed. All data expressed as a percentage to the 20th (final) pulse at 10 s. Statistical significance at *p < 0.05, one way ANOVA.

