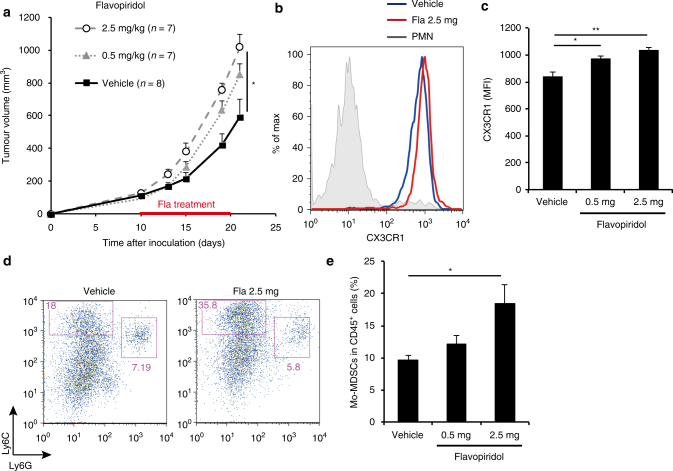
Fig. 6.
Flavopiridol accelerates tumour growth in vivo. a SCT growth curve in WT mice administered flavopiridol (2.5 or 0.5 mg/kg) or vehicle (control) once daily, from day 10 to day 20. b Representative flow cytometry histograms showing CX3CR1 expression in splenic Mo-MDSCs from WT mice 10 days after flavopiridol administration. c Mean fluorescence intensity (MFI) of CX3CR1 expression shown in b (n = 4). d Representative flow cytometry plots of CD45+CD11b+-gated cells in tumours from WT mice after flavopiridol administration; cells were labelled with CD45, CD11b, Ly6C and Ly6G antibodies. e Fraction of CD11b+Ly6ChighLy6G− cells among CD45+-gated cells shown in d (n = 5). Data are presented as the mean ± SEM. The statistical significance was determined by Student’s t-test; *p < 0.05 and **p < 0.01

