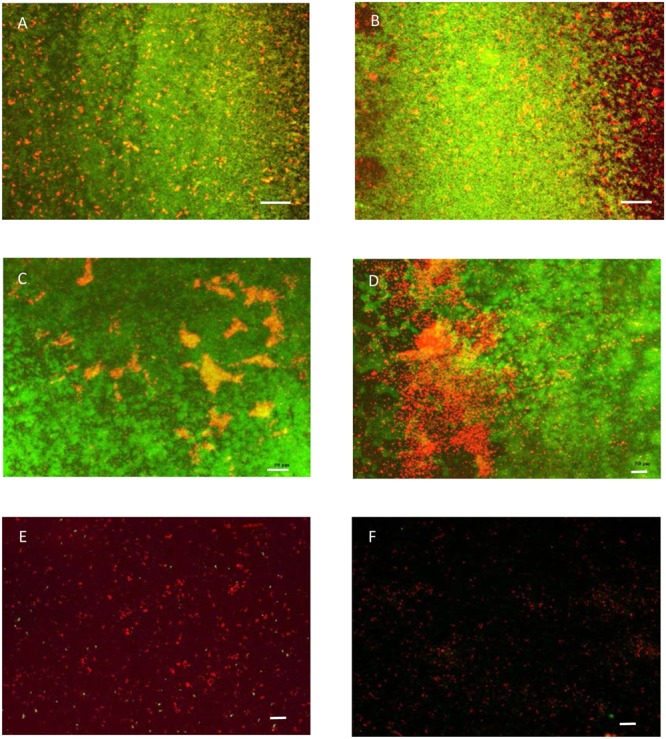
FIGURE 2.

The live/dead assay on cells in Zone I (A,B), Zone II (C,D), and Zone III (E,F) biofilms. Biofilms were grown for 48 h in rich growth medium supplemented with glucose on glass surfaces and treated with Klercide B for 20 min. Scale bars in (A) and (B) represent 100 μm, in other panels they represent 50 μm.
