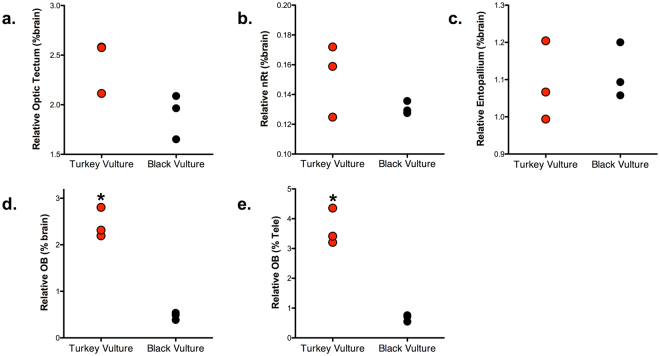
Figure 2.
Univariate scatterplots of the relative size of the following brain regions in turkey vultures (red) and black vultures (black), expressed as a proportion of total brain volume: (a) optic tectum; (b) nucleus rotundus (nRt); (c) entopallium; and (d) olfactory bulbs (OB). (e) A univariate scatterplot of olfactory bulb volume expressed as a percentage of total telencephalon volume. Significant differences between the two species are indicated by an asterisk.

