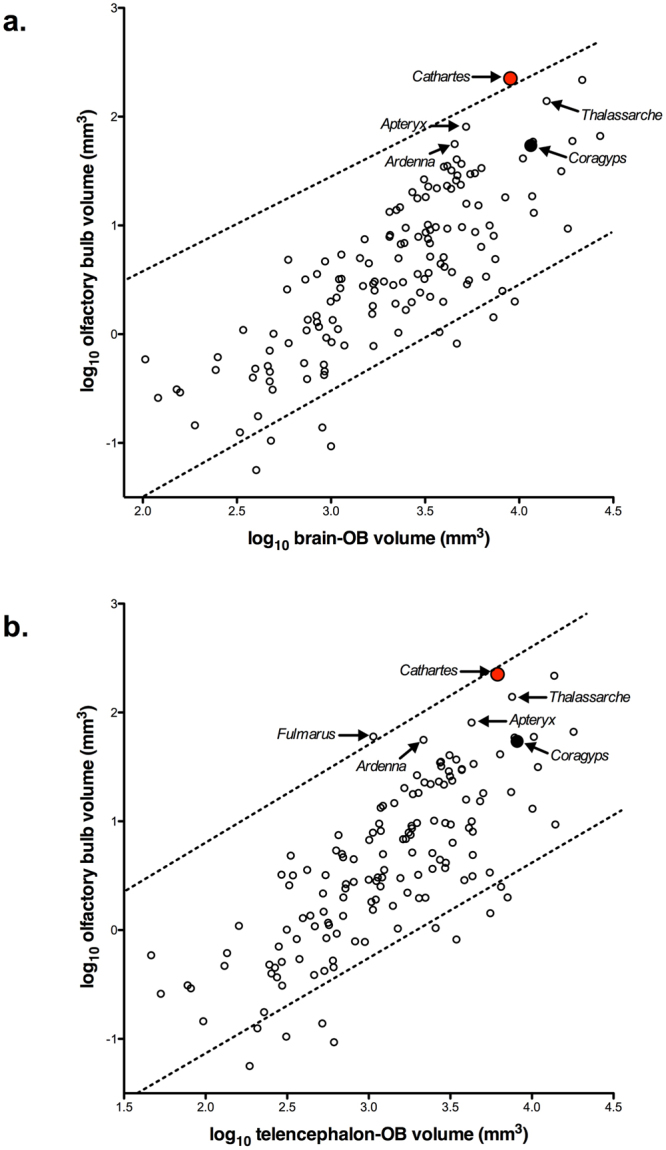
Figure 3.

Scatterplots of olfactory bulb (OB) volume plotted against: (a) brain minus OB volume; and (b) telencephalon minus OB volume. The dotted lines in both scatterplots indicate the 95% prediction interval, which incorporates phylogenetic relatedness. The turkey vulture (Cathartes aura) is indicated by the red circle, the black vulture (Coragyps atratus) by the black circle and all other bird species by open circles. Arrows indicate the two vulture species as well as several species that have notably keen olfaction (Apteryx australis, Fulmarus glacialis, Ardenna tenuirostris and Thalassarche melanophrys).
