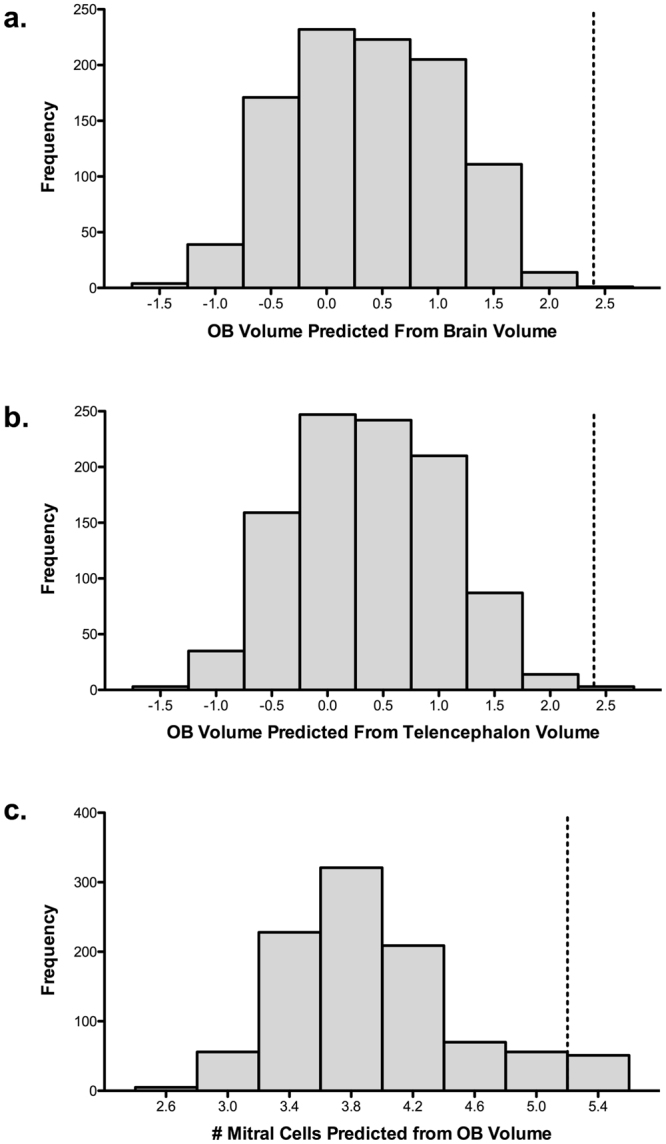
Figure 4.

The frequency distribution graphs reflect the posterior probability for the predicted olfactory bulb (OB) volume of the turkey vulture based on phylogeny and the allometric relationship with: (a) brain volume; and (b) telencephalon volume. In c) the frequency distribution reflects the posterior probability for the predicted number of mitral cells of the turkey vulture based on phylogeny and olfactory bulb volume. The observed value of the turkey vulture olfactory bulbs (a,b) and mitral cells (c) is indicated by dotted lines. For the olfactory bulbs, the observed values are beyond the 99th percentiles. The number of mitral cells, however, falls on the 95th percentile.
