Fig. 5.

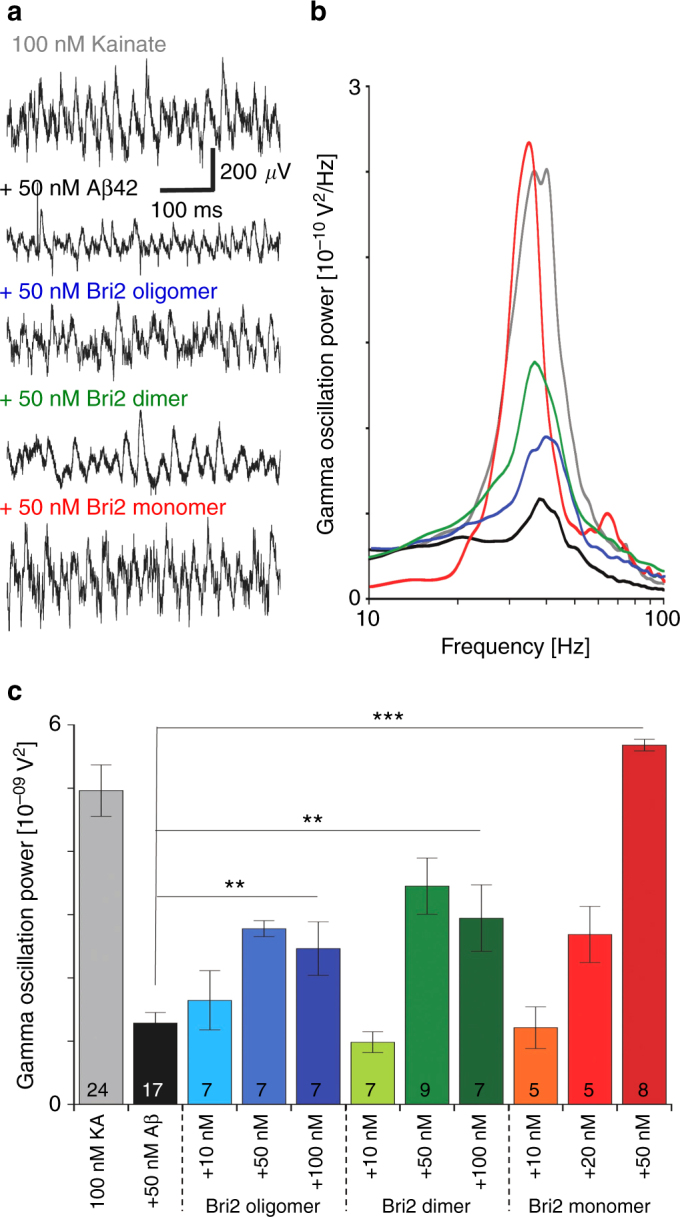
Effects on Aβ42 toxicity in mouse hippocampal slices of different rh Bri2 BRICHOS species. a Example traces of γ oscillations under control conditions (gray), after 15 min incubation with 50 nM Aβ42 (black) and after 15 min incubation with 50 nM Aβ42 + 50 nM oligomer, dimer or monomer (blue, green and red, respectively). b Example power spectra of γ oscillations under control conditions (gray), after 15 min incubation with 50 nM Aβ42 (black) and after 15 min incubation with 50 nM Aβ42 + 50 nM oligomer, dimer or monomer (blue, green and red, respectively). c Summary histogram of γ oscillation power under control conditions (gray), after 15 min incubation with 50 nM Aβ42 (black) and after 15 min incubation with 50 nM Aβ42 + three concentrations of oligomer, dimer or monomer (blue, green and red, respectively). The figures under the histograms denote number of biological replicates, and the data are reported as means ± standard errors of the means
